Redstone™ Optical Spectrum Analyzer Chapter 8: Operation
Rev C, January 21, 2022 Page 52
Power Analysis tracks the incident optical power into the spectrometer (see Section 13.1 for the precision of the
power analysis at different wavelengths). The optical power is calculated by integrating the Active trace over a
x-axis range.
The Power Analysis tool is displayed in a floating window by default, but can be docked below the main display
area, as described in Section 8.9.1. It displays the optical power, integrated over some wavelength or frequency
range, in the current y-axis units (mW or dBm). The x-axis range over which the power is integrated can be
modified either by dragging the range lines or by typing new values into the input boxes (described in Section
8.9.2). Changes to the range will take effect immediately.
Movable markers 1 and 2 (see Section 8.5) can also be used to specify the analysis range. Enabling the markers
activates the “Get From Markers” button located below the two input boxes. Pressing this button retrieves the
positions of the two movable markers and recalculates the optical input power. The interval can also be defined
by the range of the currently displayed data by pressing the “Use Displayed Range” button found below the
input boxes.
Note that zooming or scrolling the graph will not automatically change the interval.
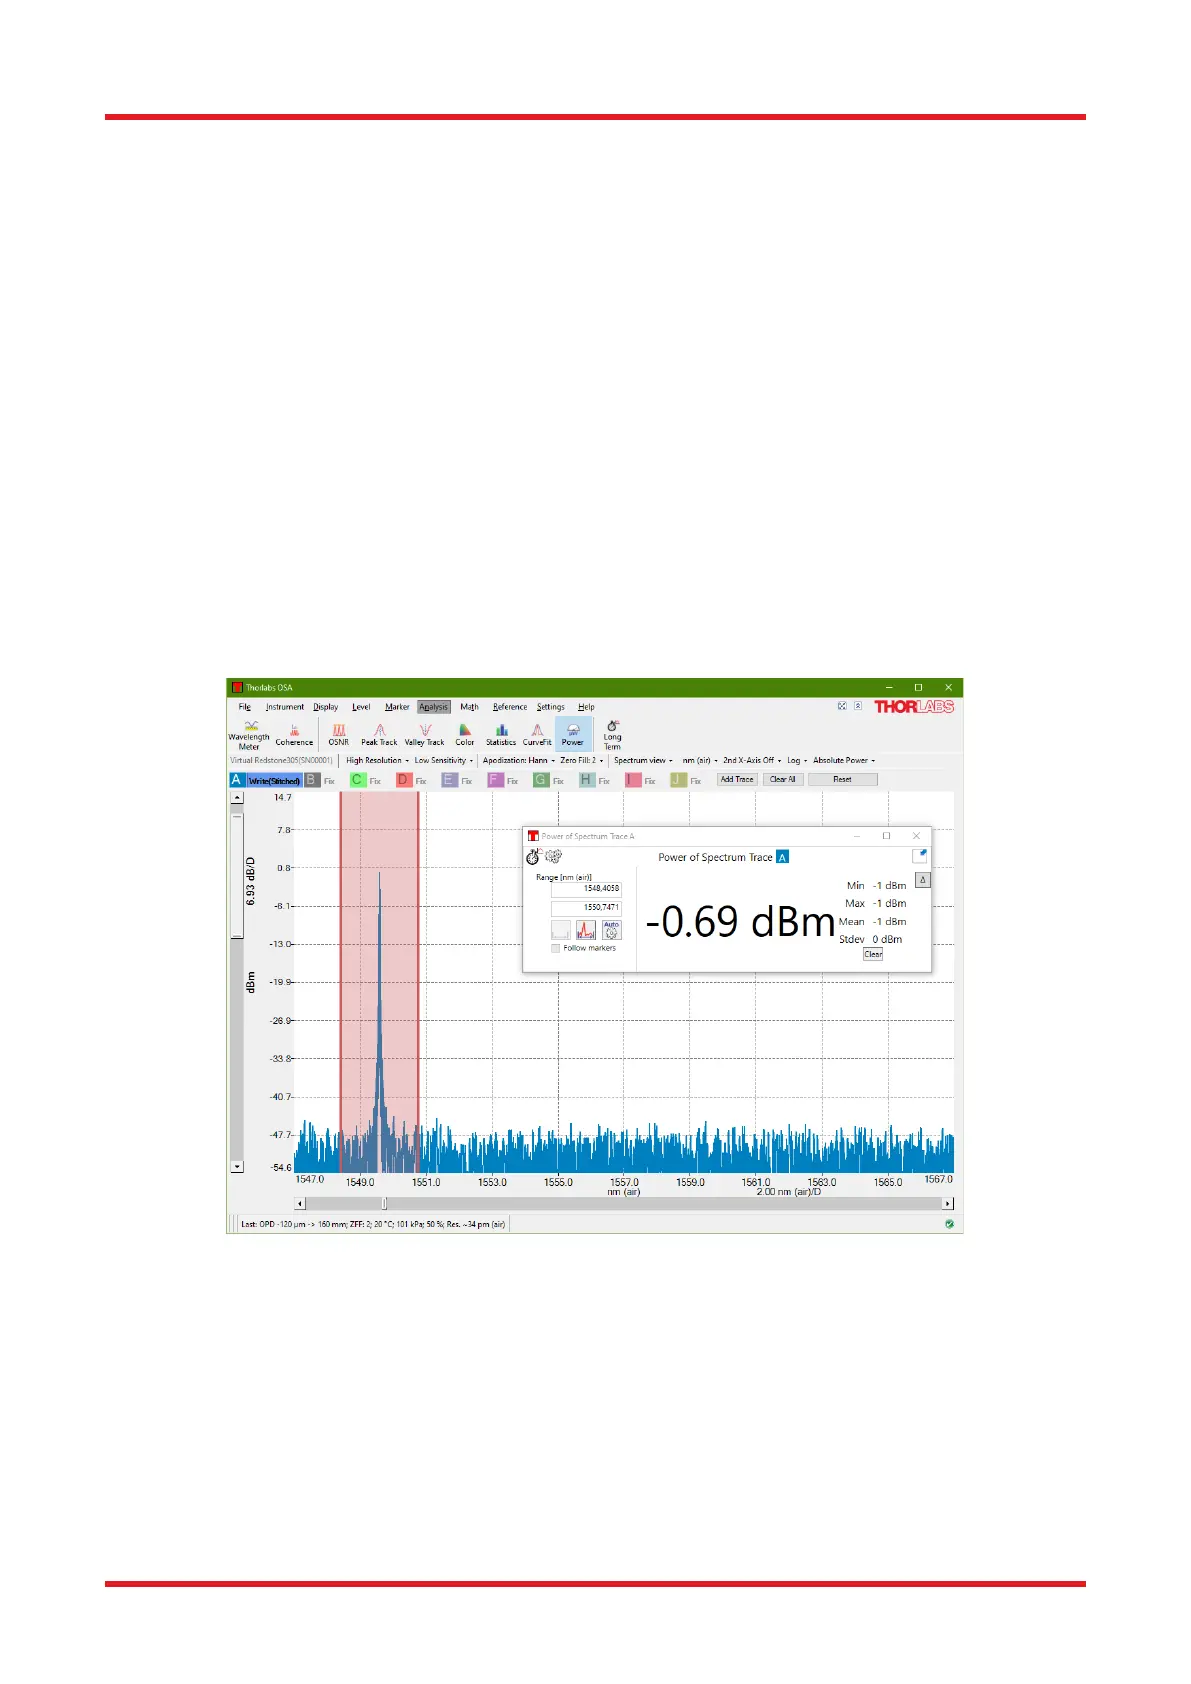
The Power Analysis window shows the minimum, maximum, mean, and standard deviation of the optical powers
that have been measured while the Power Analysis tool has been active. The values are updated after every
new sweep and are reset if the x-axis range is changed. The statistics can also be reset by clicking the “Clear”
button.
Figure 53. Power Analysis Tool
To get an accurate reading of the power level of narrowband sources (e.g., lasers) in Absolute Power mode, it
is recommended that you use a zero fill factor (ZFF) of 1 or 2, which can be set in the Acquisition controls or in
the “Spectrum” tab in the Settings dialog, see Sections 4.11 Zero Fill and 9.2.4 Spectrum Settings. This feature
adds more data points to the spectrum, making the peak location clearer. However, it does not increase the
resolution. In Figure 5453, the green trace has ZFF = 0 and the black trace has ZFF = 2 (four times as many
points in the spectrum). In general, a higher ZFF gives a more accurate power level reading at the laser peak,
since the peak usually lies between two data points. For instance, for the green trace in Figure 5453, which has
ZFF = 0, the measured power is 13% too low.

 Loading...


