136 Chapter 6 – Color Workflow
Reading Color Density Data
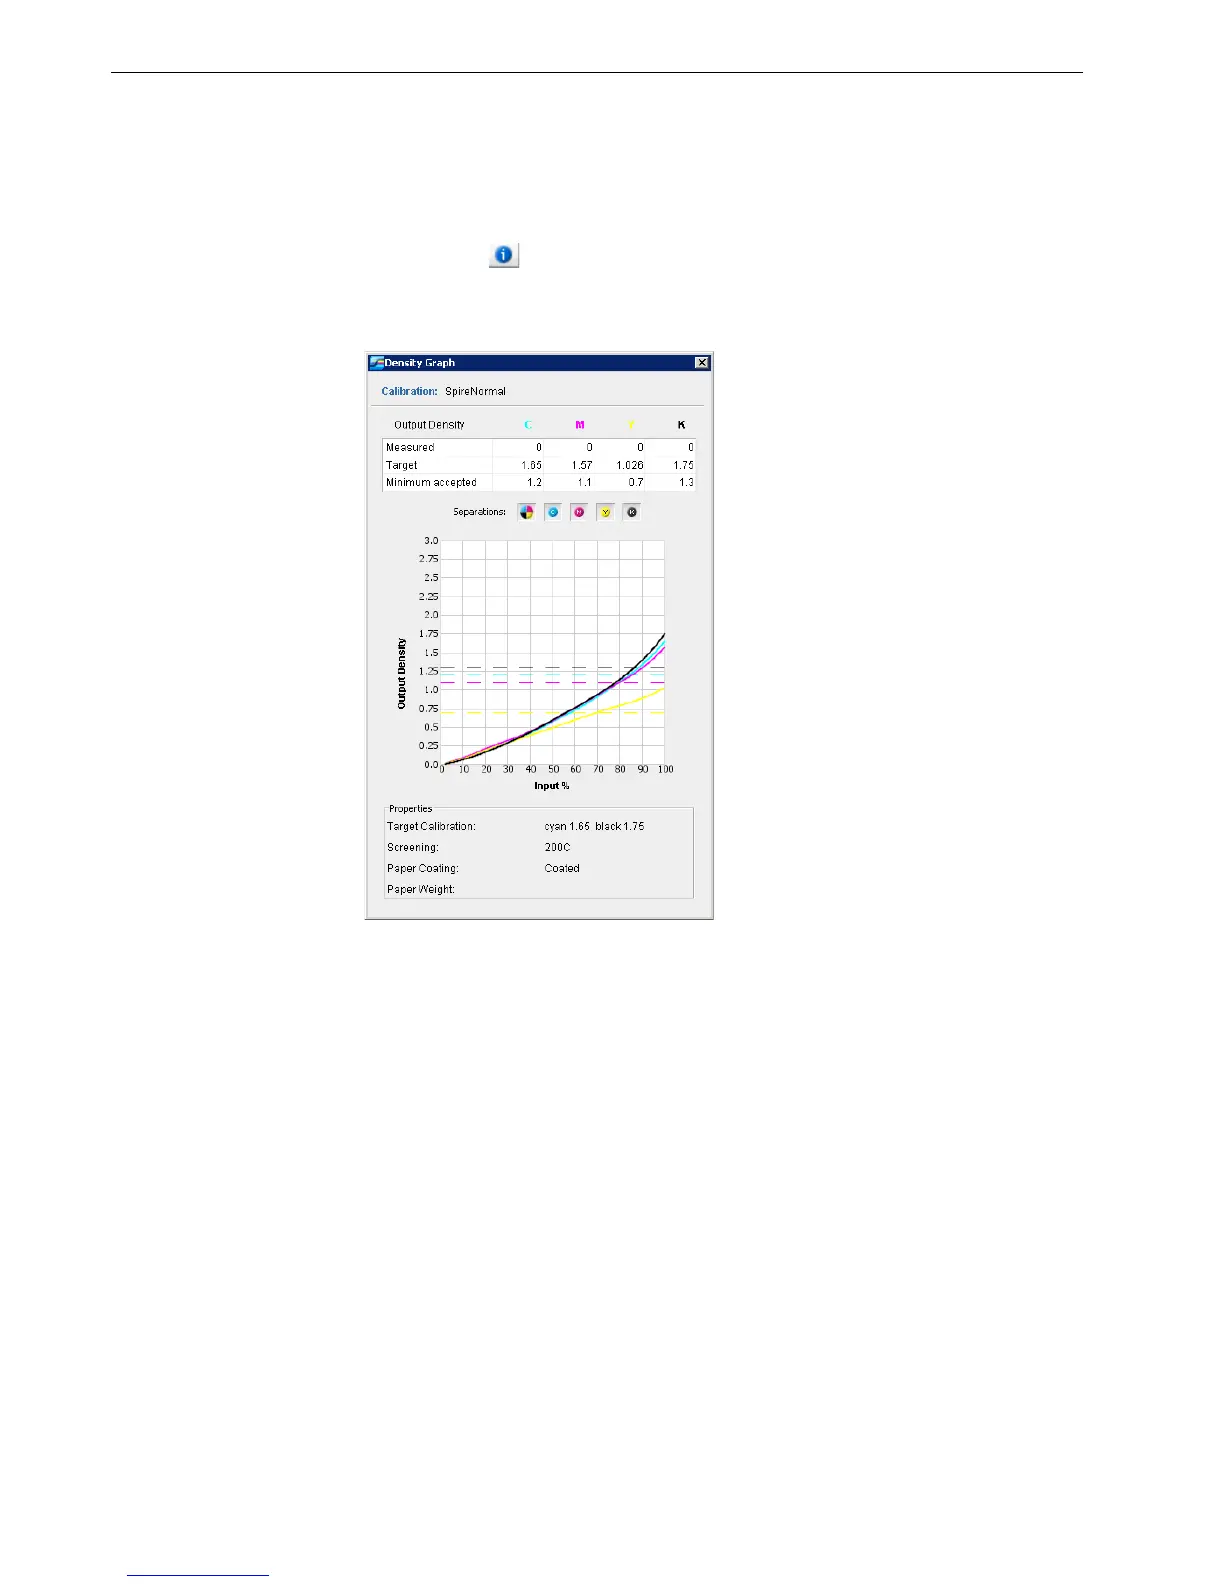
To view the Density Graph:
1. In the Calibration window, from the Calibration Name list, select the table for
which you want to receive detailed color information.
2. Click
Info .
The Density Graph window appears. The Density Graph gives you detailed
information about the saved calibration tables.