2- 25
Making Mixer Measurements
High Dynamic Range Swept RF/IF Conversion Loss
5. To select the converter type and low-side LO measurement configuration, press:
In this low-side LO, down converter measurement, the analyzer's source frequency range will be offset
higher than the receiver frequency range. The source frequency range can be determined from the
following equation:
receiver frequency range (100 – 1000 MHz) + LO frequency (1500 MHz) = 1.6 2.5 GHz
6. To view the conversion loss in the best vertical resolution, press:
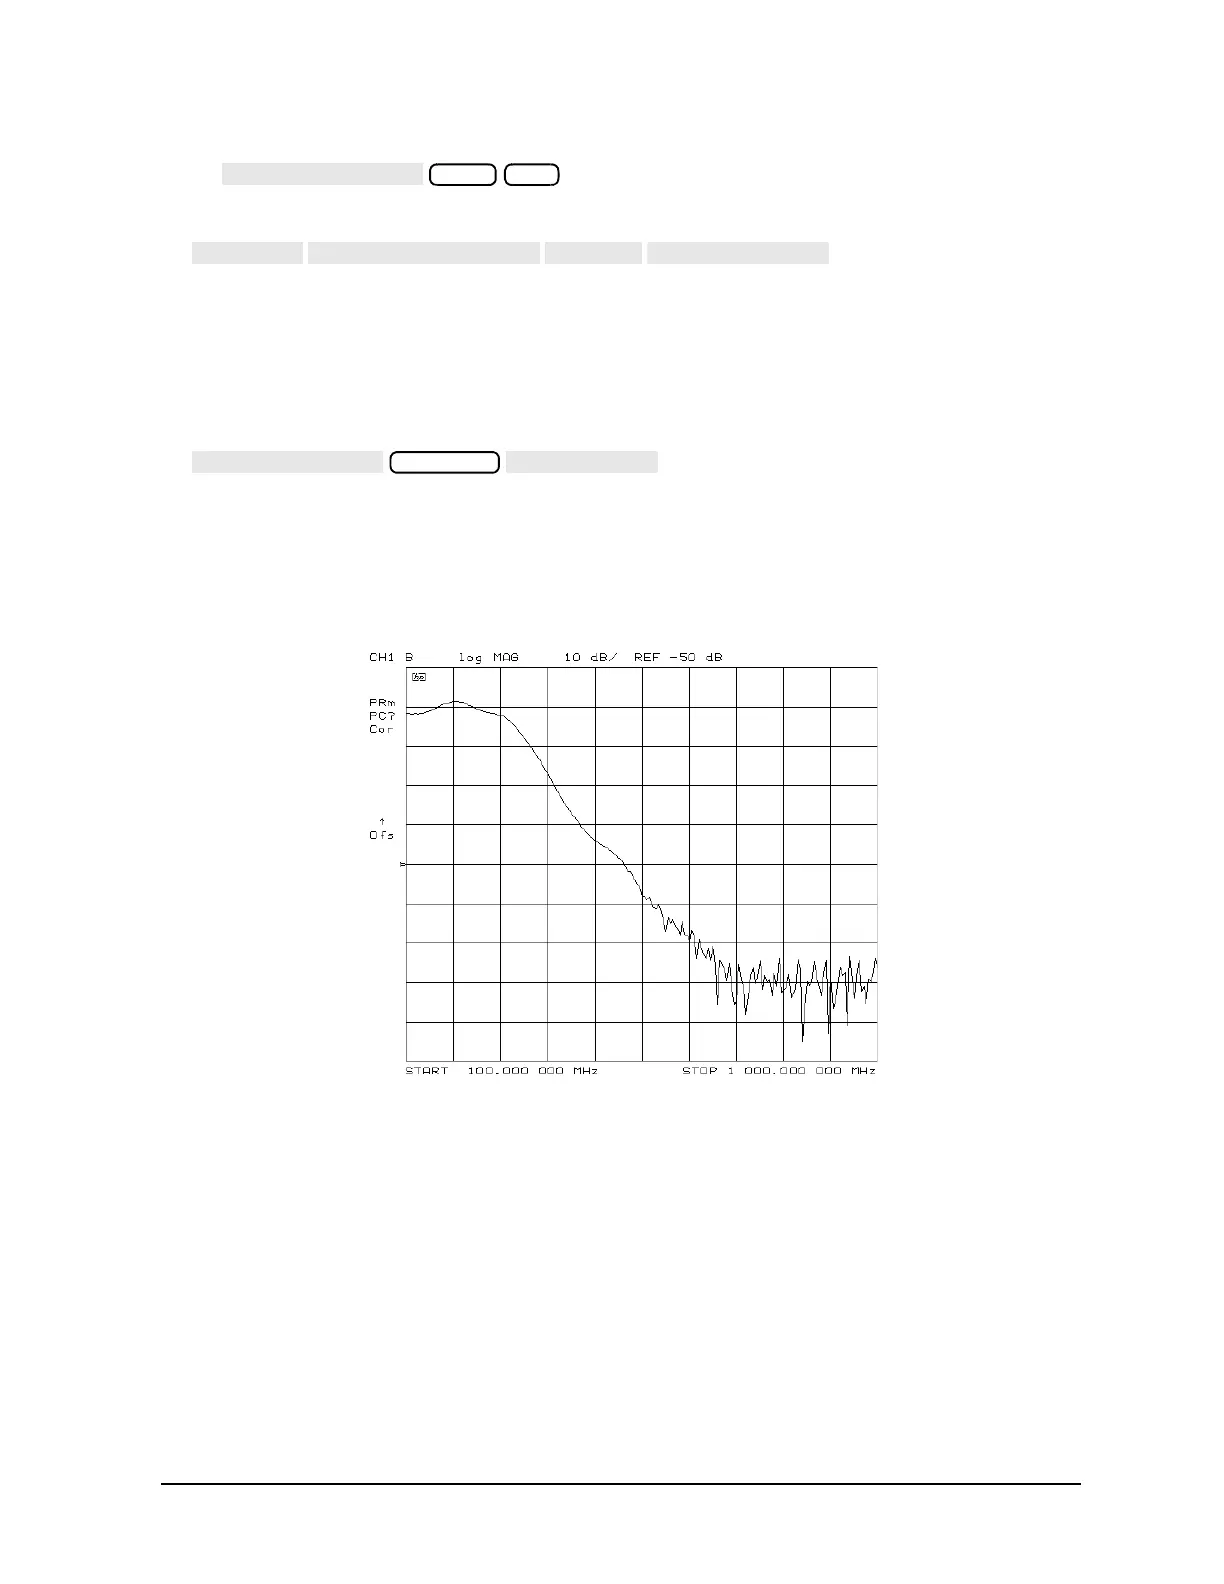
Figure 2-20 shows the conversion loss of this low-side LO mixer with output filtering. Notice that the
dynamic range from the pass band to the noise floor is well above the dynamic range limit of the R
Channel. If the mixer under test also contained amplification, then this dynamic range would have been
even greater due to the conversion gain of the mixer.
Figure 2-20 Example of Swept IF Conversion Loss Measurement

 Loading...


