Rockwell Automation Publication 1441-UM001B-EN-P - September 2012 167
Collecting and Reviewing Data Chapter 5
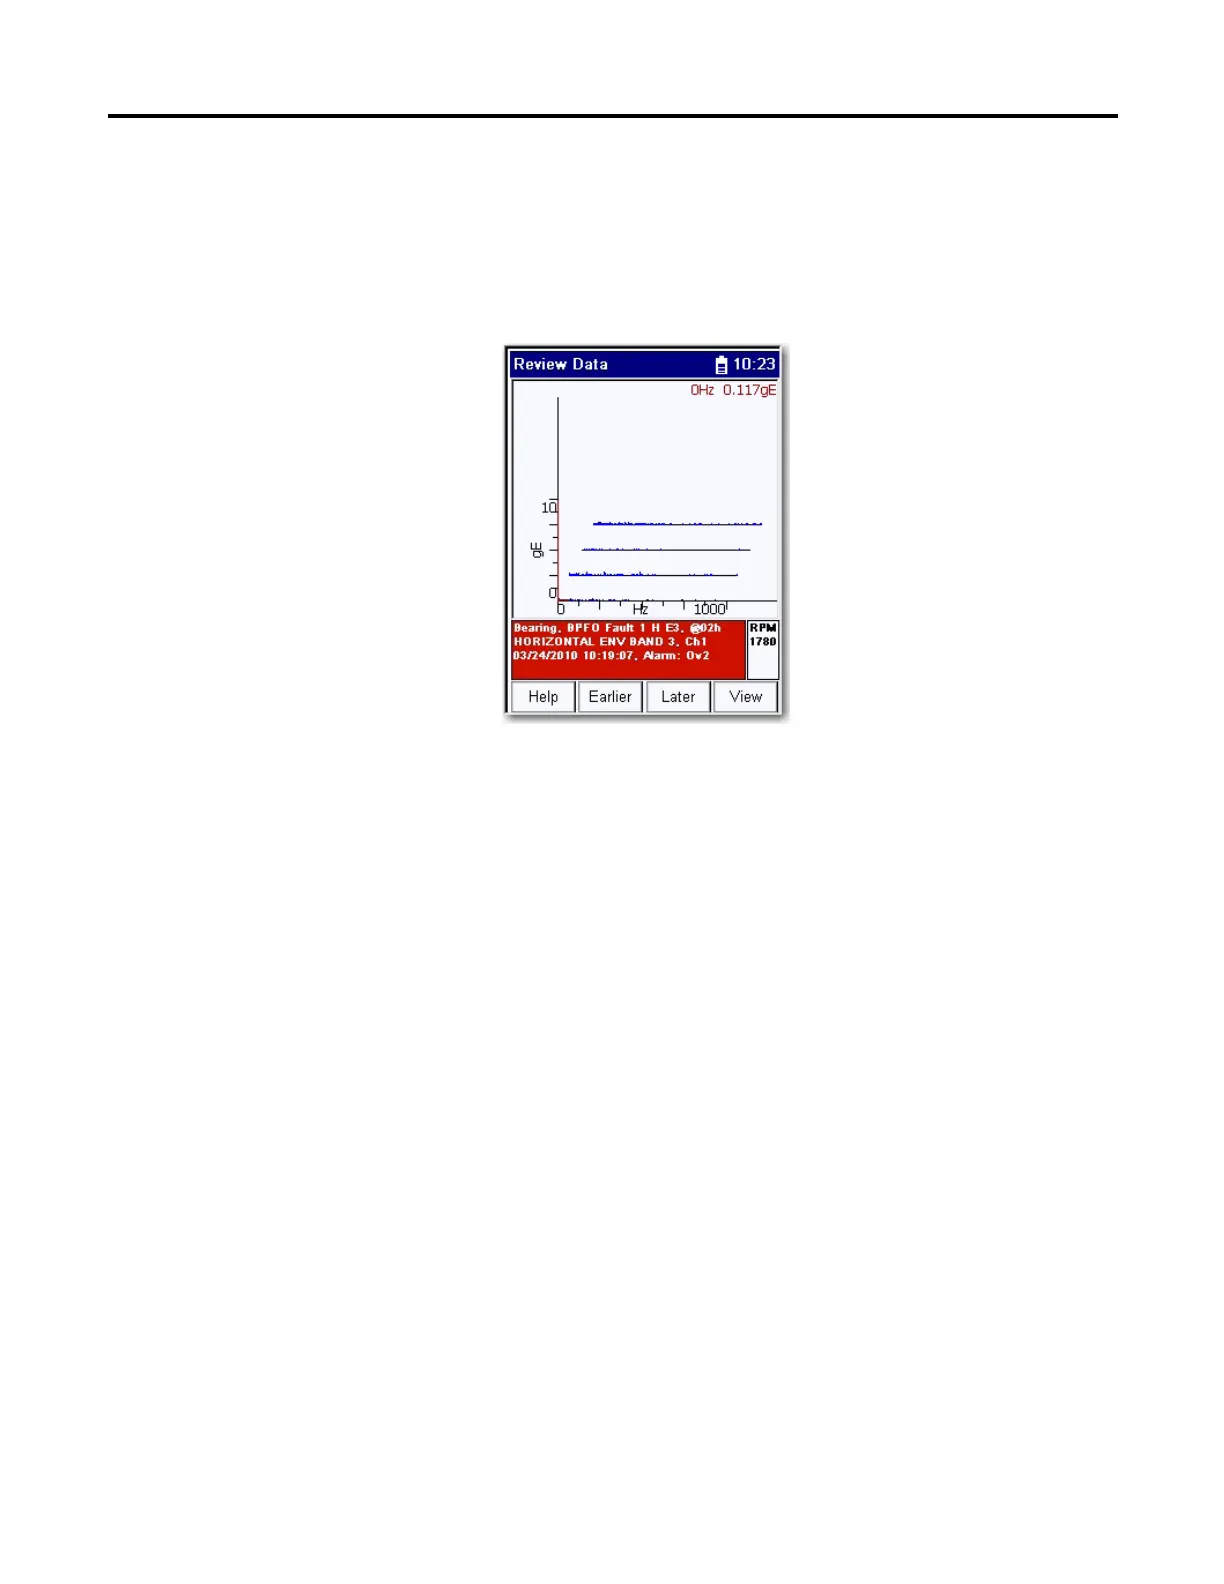
Review Waterfall Spectra Data
When you collect more than one spectrum for a point, the Dynamix 2500 data
collector can display the spectrum in a waterfall mode, one after the other.
Figure 25 - Waterfall Spectral Data
• Press the Left and Right arrow keys to move the frequency cursor within
the spectrum plot.
• Use the Up and Down arrow keys to move between the spectrum plots.
The Waterfall spectra data will not appear if you set Hist. Data
Review to Always Single in the Instrument Configuration
screen.
 Loading...