Patient monitor User’s manual
Chapter 17-5
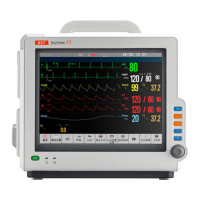
The screen shows an EEG waveform, trend graph and CSM parameters.
Waveform and Trend Graph Display
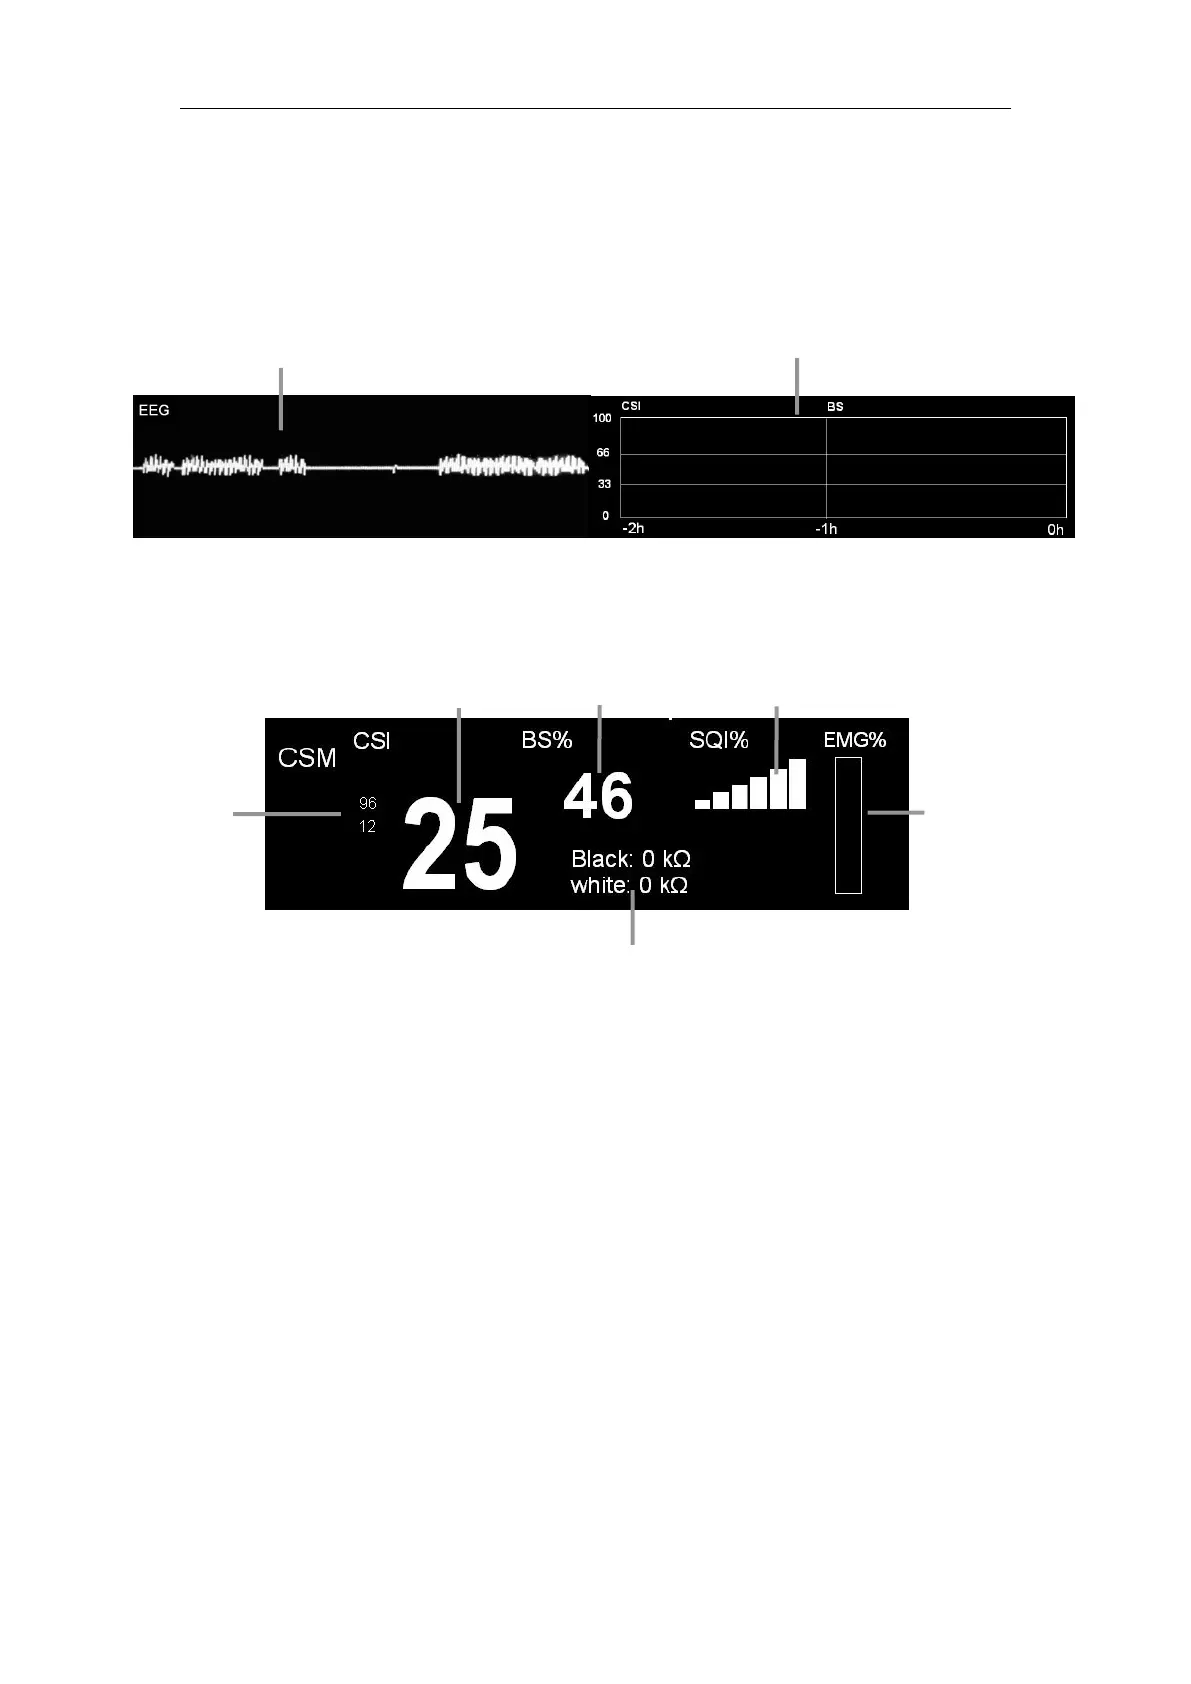
a) CSI: Cerebral State Index. The CSI is a unit-less scale from 0 to 100, where
0 indicates a flat EEG and 100 indicates EEG activity corresponding to the
awake state.(The further information on CSI refer to the below section.)
b) BS%: The amount of Burst Suppression (very low-amplitude or “flat” EEG)
is displayed on the screen. Burst Suppression indicator is to show periods
when the EEG is iso-electric or “flat”. It shows the percentage of burst
suppression over the last 30 seconds of the EEG signal. A BS% = 20 readouts
means that the EEG has been iso-electric during 20% of the last 30 seconds.
c) SQI%: SQI% measures the quality of the acquired EEG signal.