Patient monitor User’s manual
Chapter 22-12
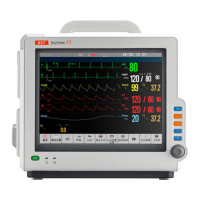
interphase scatter. The scatter displays the linearity and nonlinear variety
trend of HRV. According to the scatter, you can see the state of autonomic
tones function.
Select【Scatter】of the【HRV Analyze】menu , then the scatter can be
displayed as follows:
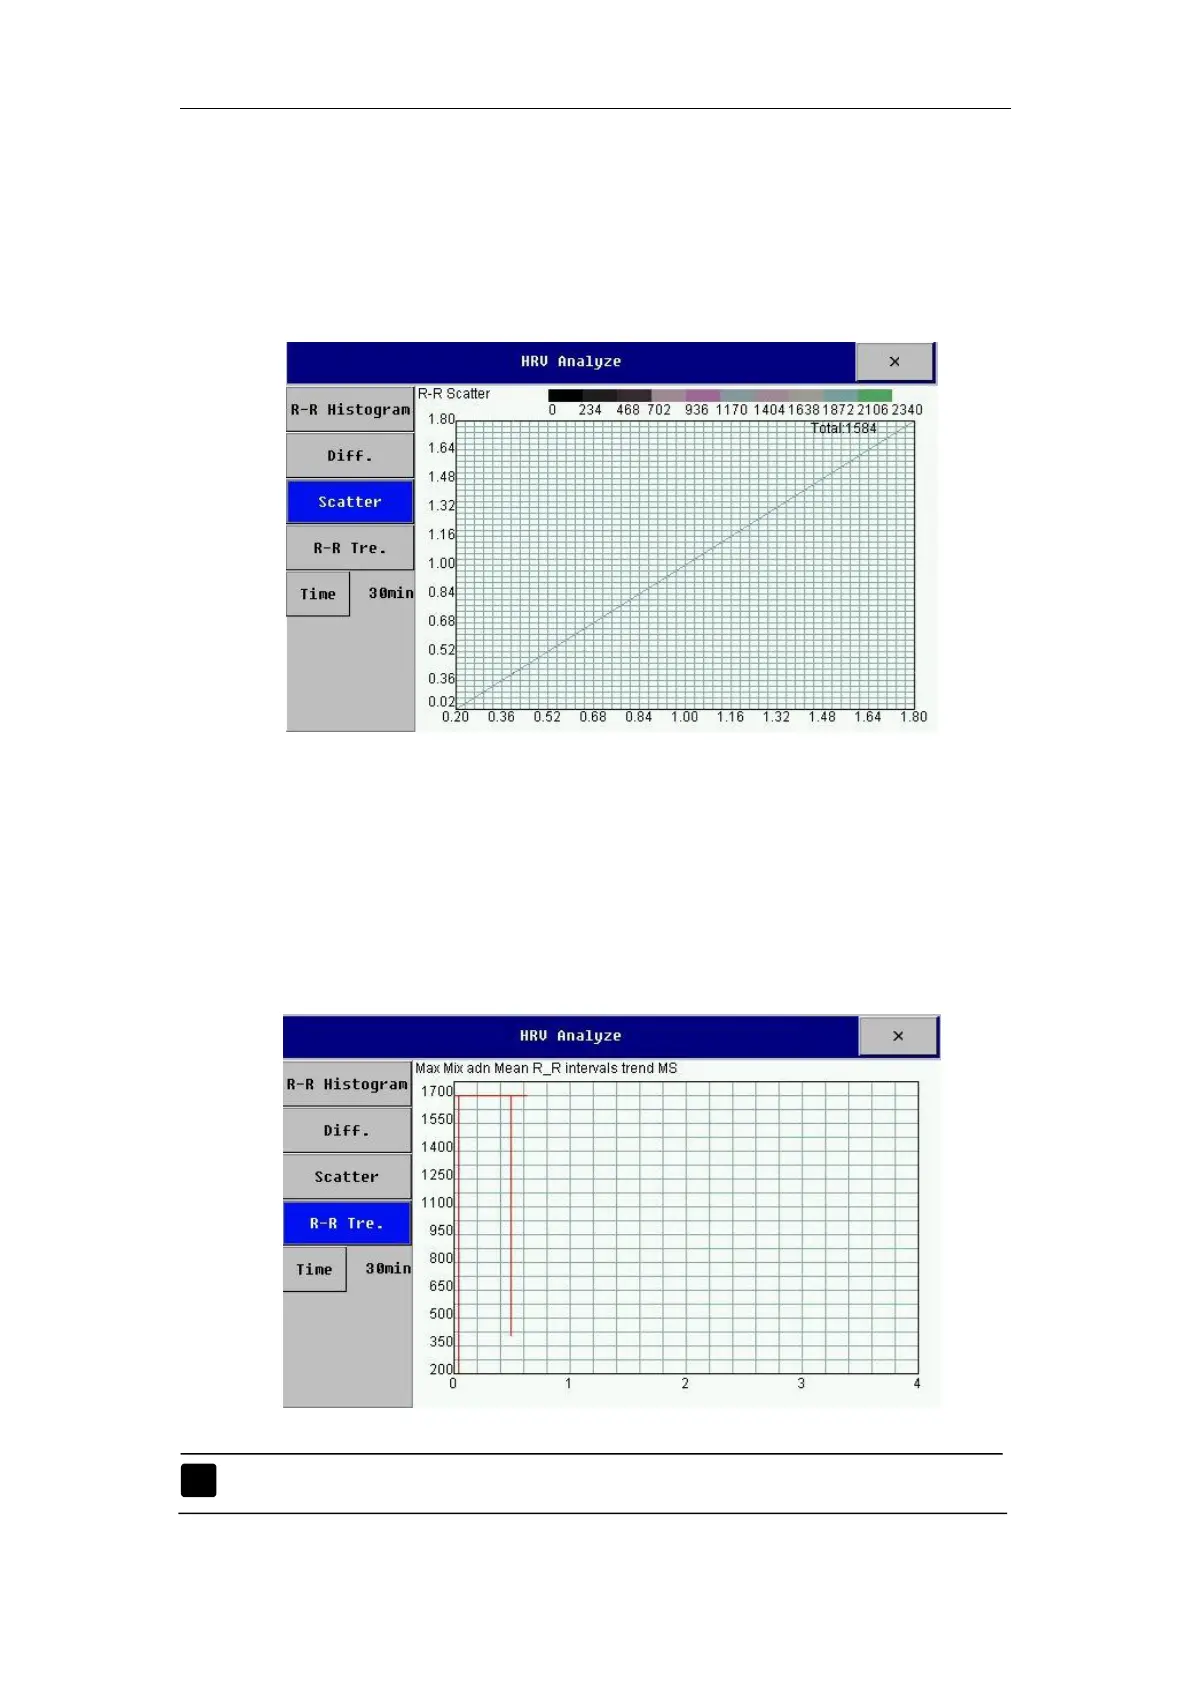
It is the summarizing of all kinds of indexes after analyzing the data in a
period of time. It reflects its variety. The abscissa is time. And the ordinate is
the average of R-R interphase in a period of time.
Select【R-R Tre.】 of the【HRV Analyze 】menu , then the R-R trend
graph can be displayed as follows:
Note: HRV analysis can not be used on patient with pacemaker.