Model 8640B TM 9-4935-601-14-7&P
PERFORMANCE TESTS
4-32. AM 3 dB BANDWIDTH TEST (Cont'd)
PROCEDURE:
1. Connect equipment as shown in Figure 4-18 after setting Signal Generator's controls as follows:
Meter Function................................................................................................AM
COUNTER MODE: EXPAND ..........................................................................Off
LOCK ..............................................................................Off
Source ........................................................................... INT
AM .................................................................................................................DC
MODULATION..........................................................................................Full cw
FM ................................................................................................................OFF
RANGE................................................................................................8 -16 MHz
FREQUENCY TUNE..................................................................................8 MHz
OUTPUT LEVEL............................................................ +3 dBm (Vernier full cw)
RF ON/OFF ....................................................................................................ON
2. Set analyzer's center frequency controls to 1 kHz, fixed (not scanning) and adjust tracking generator's output
level controls for 50% AM as indicated on Signal Generator's panel meter.
3. Now set spectrum analyzer's resolution bandwidth to 1 kHz, and set frequency span (scan width) controls for a
zero to 100 kHz span. Set display for 2 dB per division.
4. Set analyzer's display reference level controls to display the detected sweep. Slowly tune Signal Generator from
8 to 16 MHz while noting amplitude variations from 0 60 kHz on the display. The variation should be <3 dB
referenced to the level at 1 kHz.
________3 dB
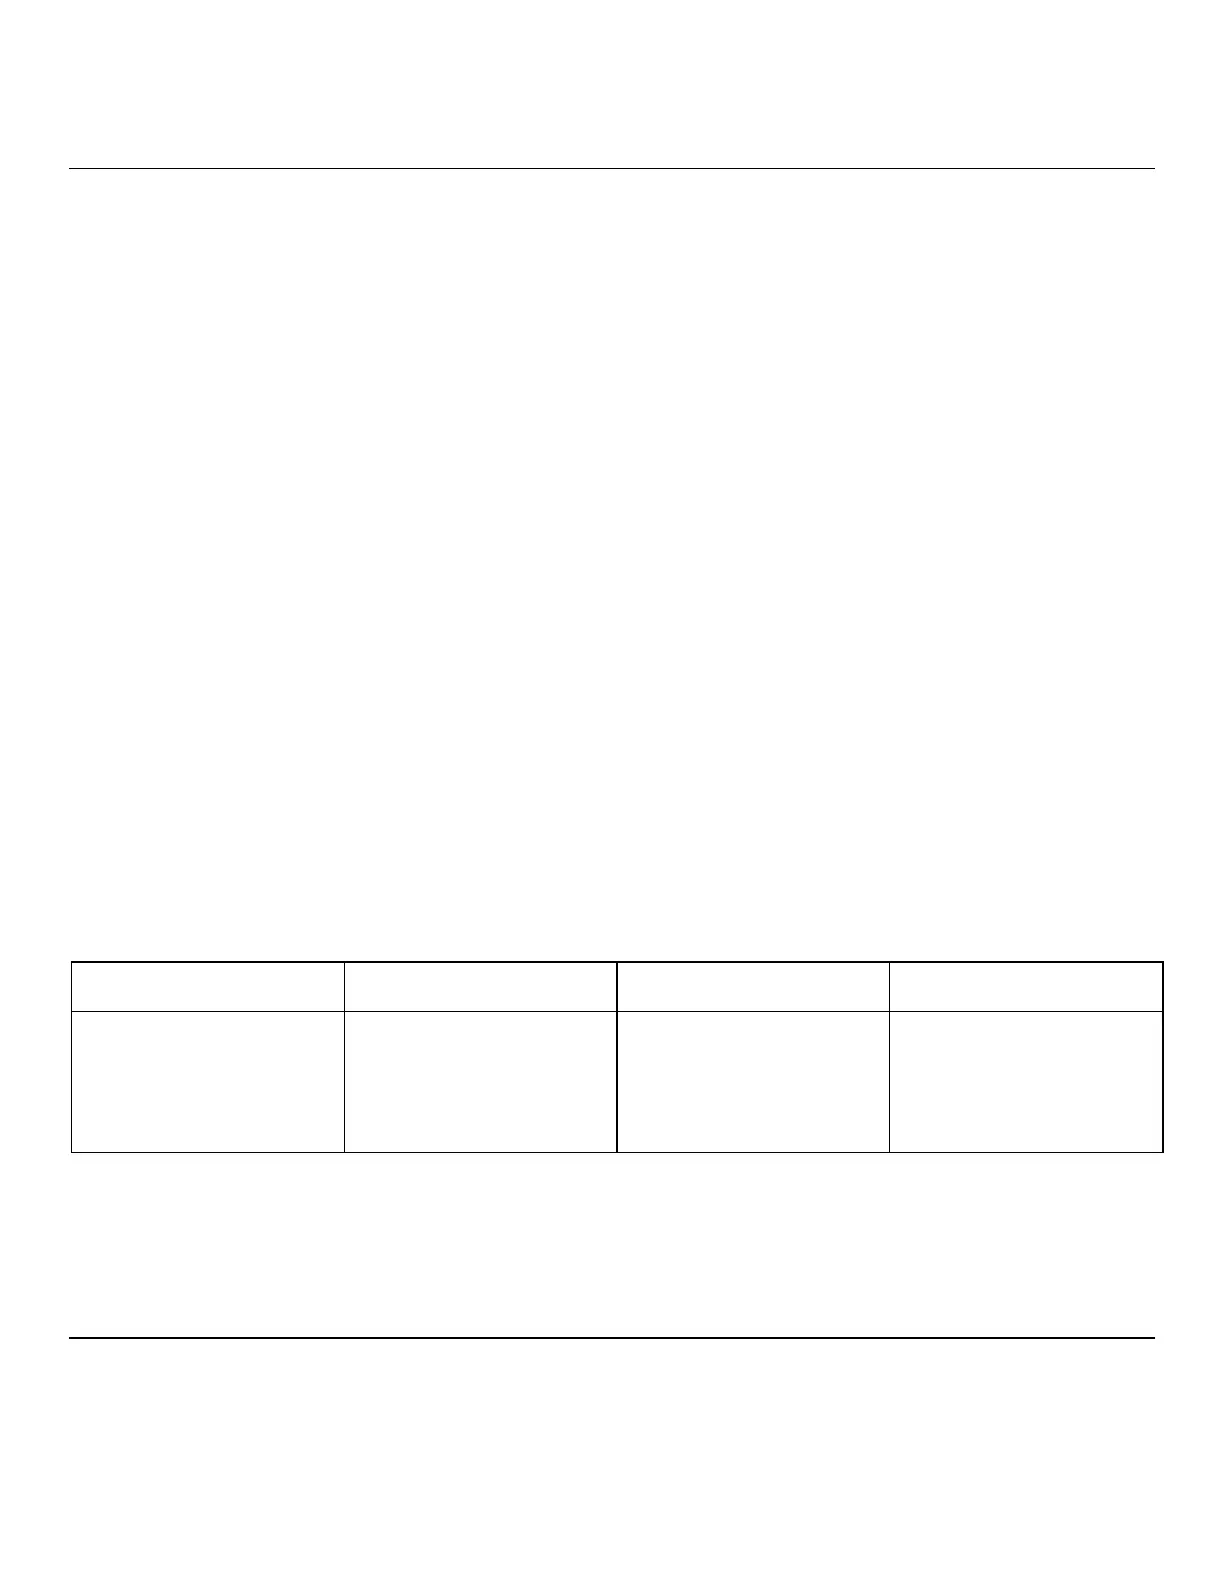
5. Set analyzer and Signal Generator as shown below. At each RANGE switch setting, repeat the procedure
outlined in steps 2 through 4, except set analyzer for the frequency and %AM shown. The amplitude variation
should, in each case, be <3 dB.
Signal Generator % AM Frequency Amplitude
RANGE (Tracking Gen. Level) Span Variation
8 -16 MHz 90% 0 to 50 kHz 3 dB
4 - 8 MHz 50% 0 to 40 kHz 3 dB
4 - 8 MHz 90% 0 to 25 kHz 3 dB
1 - 2 MHz 50% 0 to 20 kHz 3 dB
1 - 2 MHz 90% 0 to 12.5 kHz 3 dB
4-48
Artisan Technology Group - Quality Instrumentation ... Guaranteed | (888) 88-SOURCE | www.artisantg.com