Gene Expression Analysis
108
• Enter a number for the efficiency of a target. The software will calculate the relative
efficiency for a target using Auto Efficiency if the data for a target includes a
standard curve. Alternatively, type a previously determined efficiency
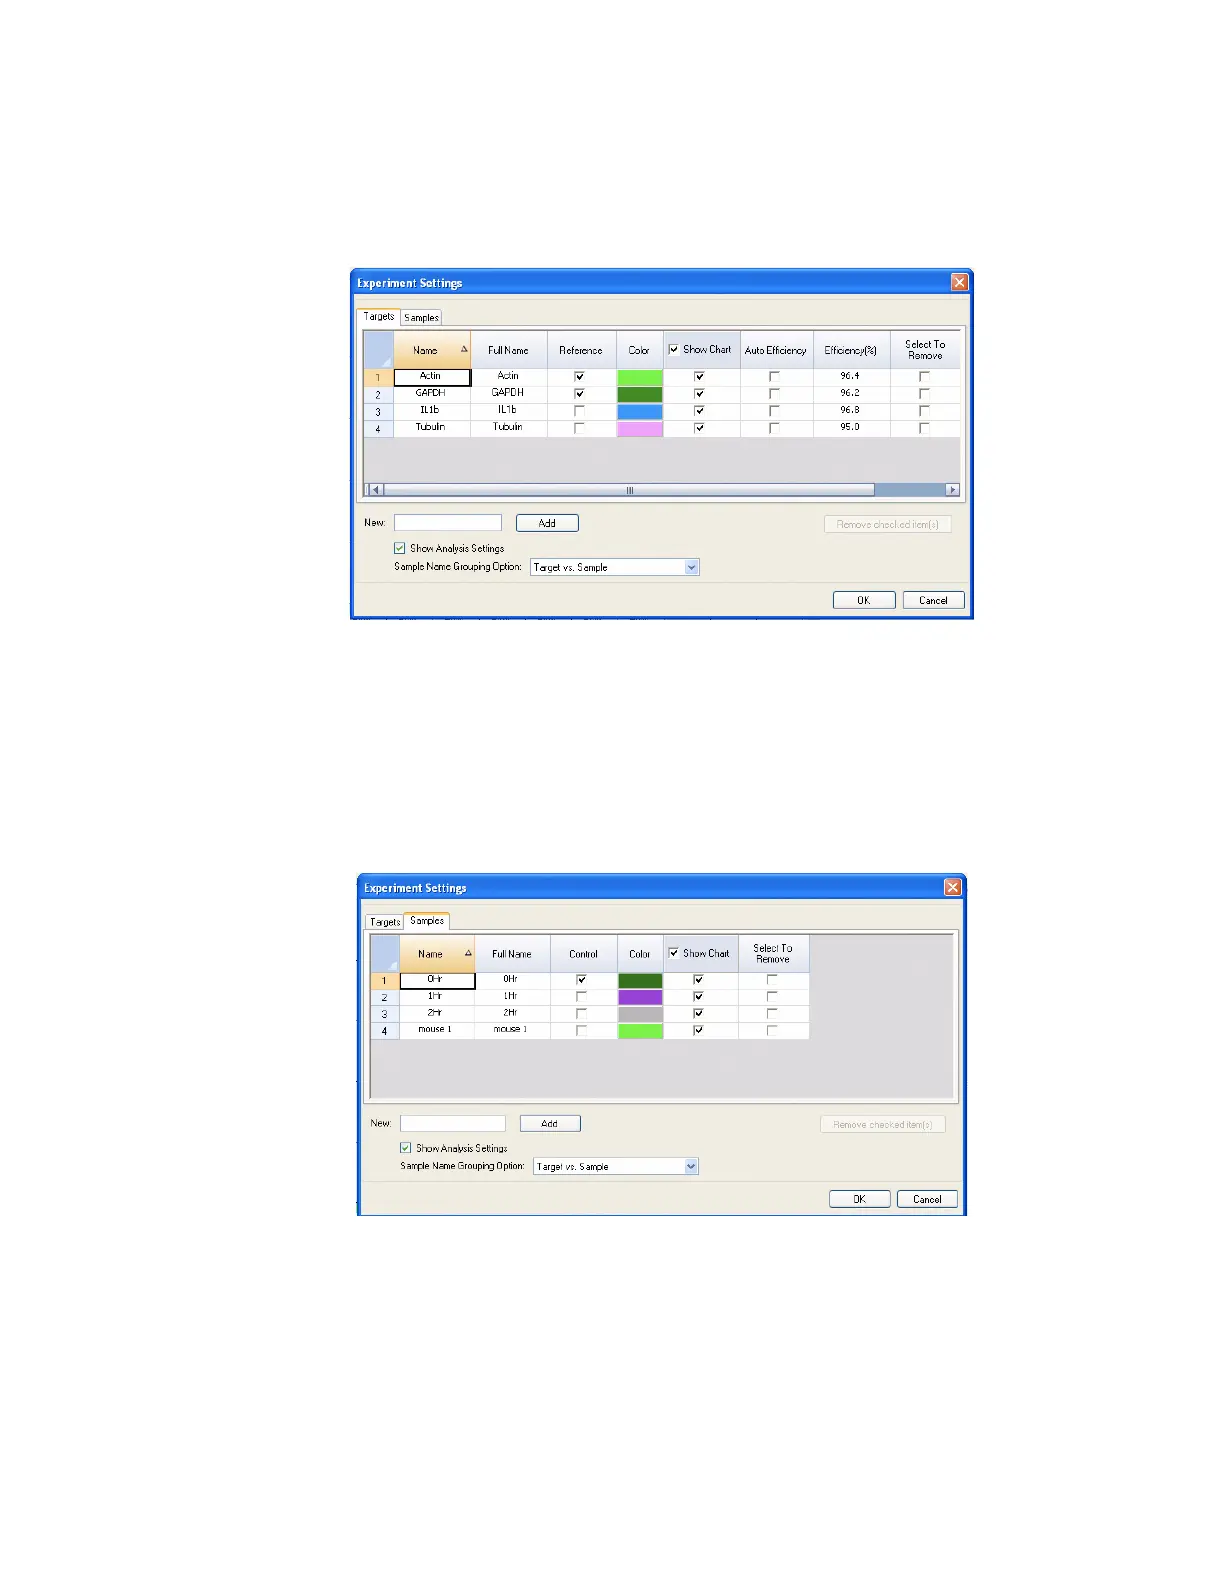
Figure 102 shows the efficiency of all the targets, which appear if Auto Efficiency is selected.
Figure 102. Targets tab in Experiment Settings window with Analysis Settings selected.
To adjust the settings for a sample in the Samples tab:
• Click a color in the Color column to change the color of the samples graphed in the
Gene Expression chart
• Click a box in the Show Graph column to show the sample in the Gene Expression
chart using a color that is selected in the Color column
Figure 103 shows the samples with the Show Graph option selected.
Figure 103. Samples tab in Experiment Settings window with Analysis Settings selected.