Gene Expression Analysis
112
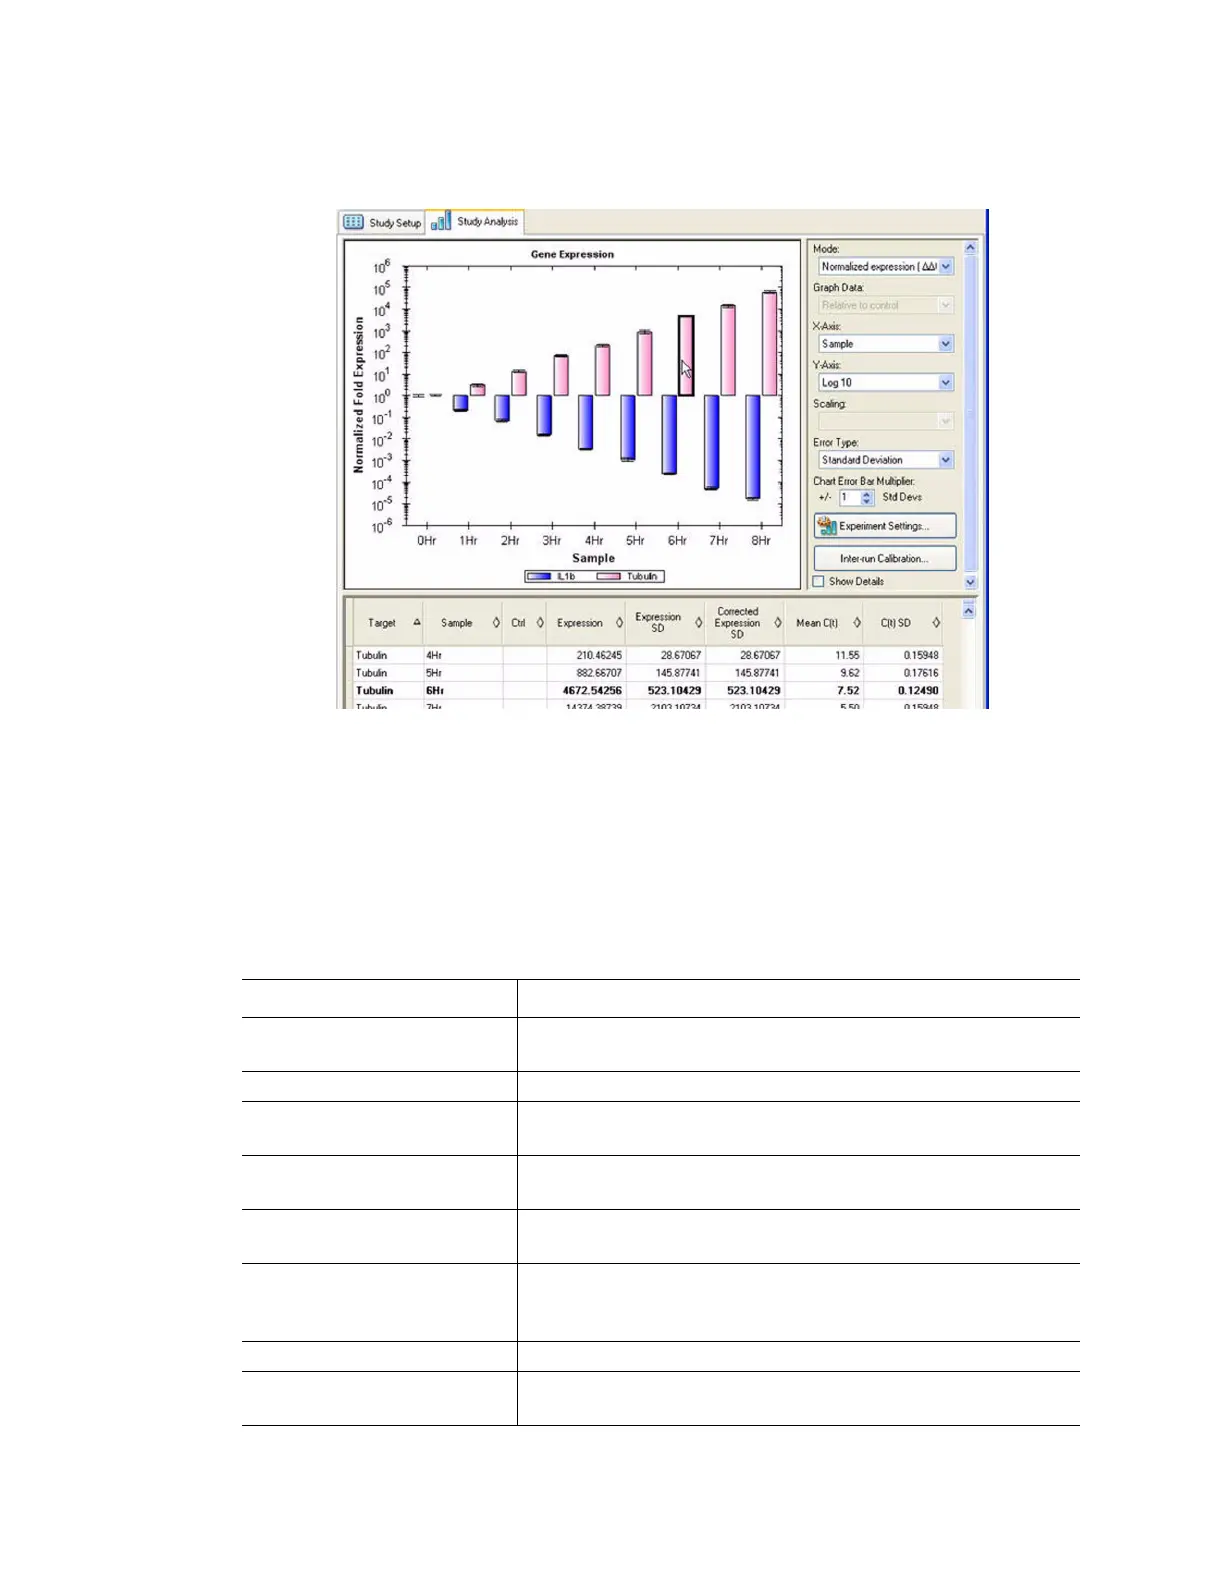
Highlighting a sample in the Gene Expression chart, highlights the corresponding cell in the
spreadsheet below the chart (Figure 105).
Figure 105. Study Analysis tab in Gene Study window.
Gene Study Data Spreadsheet
The data spreadsheet in the Gene Study window lists information about each target and
sample in the Gene Study (Figure 105).
Table 41 describes the information shown in the Gene Study spreadsheet.
Table 41. Information in the spreadsheet on the Study Analysis tab
Information Description
Target Target Name (amplified gene) selected in the Experiment
Settings window
Sample Sample Name selected in the Experiment Settings window
Ctrl Control sample, when the sample name is selected as a
control in the Experiment Settings window
Expression Normalized Gene Expression (ΔΔC(t)) or Relative Quantity
(ΔC(t)) depending on the selected mode
Expression SEM (or SD) Standard Error of the Mean or Standard Deviation, depending
on the selected option
Corrected Expression SEM
(or SD)
Corrected value calculation for Standard Error of the Mean
(SEM) or Standard Deviation (SD) of the relative expression,
depending on the selected option
Mean (C(t)) Mean of the threshold cycle
C(t) SEM (or SD) Standard Error of the Mean or Standard Deviation of the
threshold cycle, depending on the selected option