Users and Preferences
128
control, which is the default selection when no control sample is assigned in the
Experiment Settings window
•X-Axis. Graph the Target or the Sample on the x-axis
•Y-Axis. Graph Linear, Log 2, or Log 10 scale on the y-axis
• Scaling. Select a scaling option for the graph. Leave the graph unscaled. Alternatively,
choose a scaling option to scale to the Highest value or to the Lowest value
• Method. Set the default analysis mode, including normalized expression (ΔΔCt) or
relative expression (ΔCt)
• Error Bar. Select Std Dev. for standard deviation, or Std. Error Mean for the standard
error of the mean
•Std Devs. Select the standard deviation multiplier to graph the error bars. The default is
1. Change the multiplier to either 2 or 3
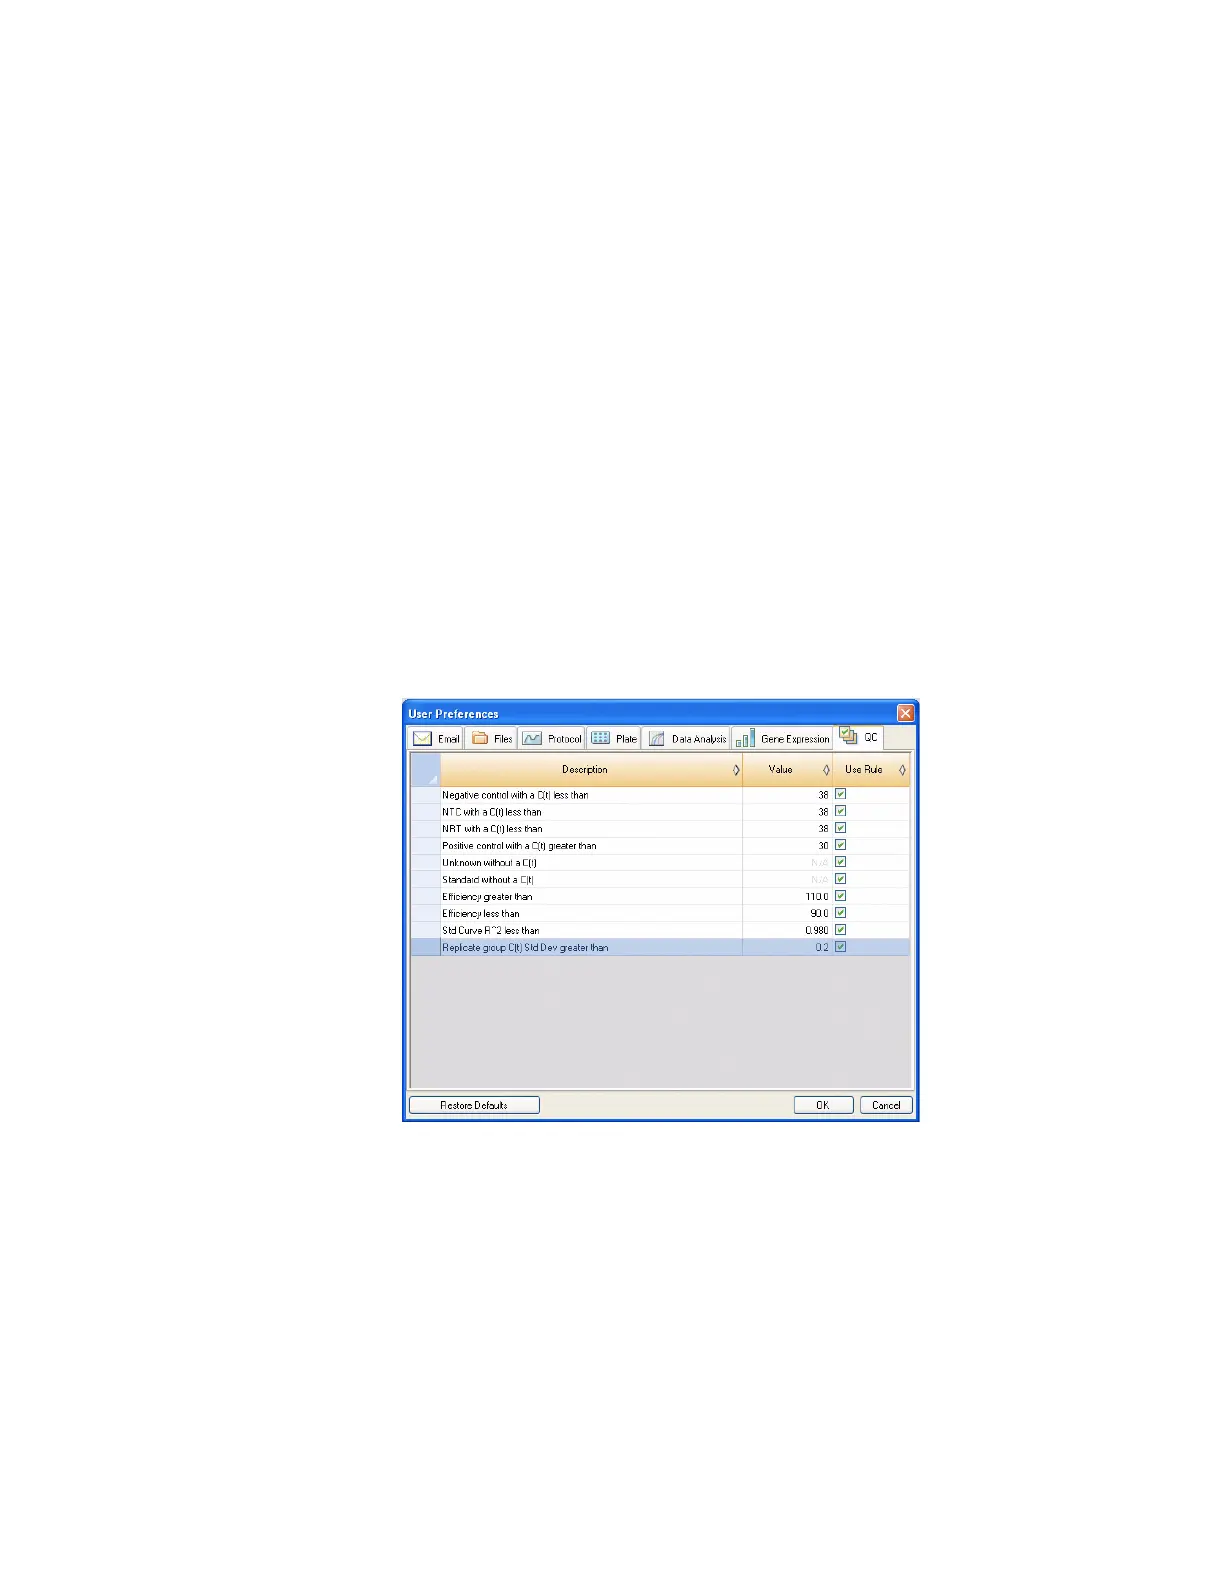
QC Tab
Select the QC tab in the User Preferences window to specify QC rules to apply to data in Data
Analysis Module. The software validates the data against the enabled tests and the assigned
values (page 128).
NOTE: Wells that fail a QC parameter can easily be excluded from analysis in the
QC module of the Data Analysis Window using the right-click menu option.
Figure 118. QC tab in User Preferences.
Specify to add cut off values and to enable the following QC rules:
• Negative control with a C(t) less than XX. Input a C(t) cut-off value
• NTC (no template control) with a C(t) less than XX. Input a C(t) cut-off value
• NRT (no reverse transcriptase control) with a C(t) less than XX. Input a C(t) cut-off
value
• Positive control with a C(t) greater than XX. Input a C(t) cut-off value
• Unknown without a C(t)
• Standard without a C(t)