Data Analysis Overview
72
Quantitation Tab
Each tab in the Data Analysis window displays data in charts and spreadsheets for a specific
analysis method, with a well selector to select the data you want to show. The Data Analysis
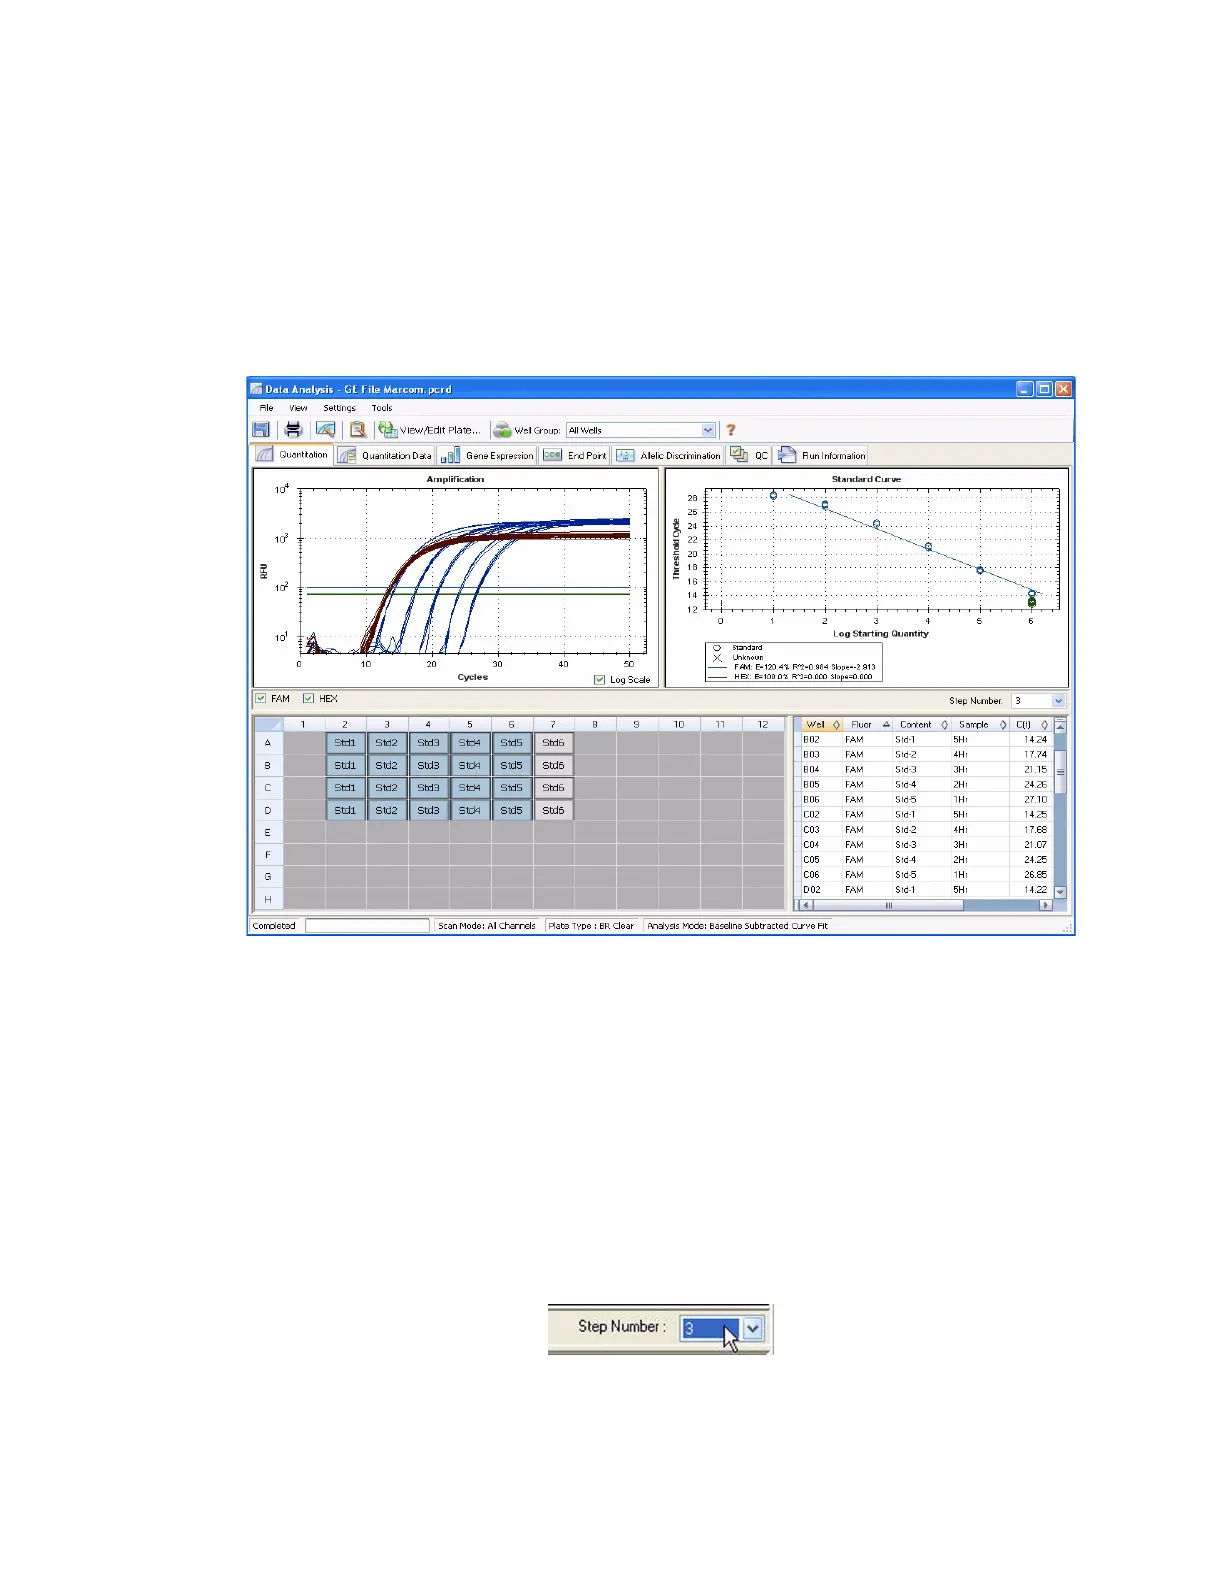
window opens with the Quantitation tab (Figure 72) in front. The Amplification chart data in
this tab should be used to determine the appropriate analysis settings for the experiment.
NOTE: The Amplification chart shows the relative fluorescence (RFU) for each well
at every cycle. Each trace in the chart represents data from a single fluorophore in
one well.
Figure 72. Layout for the Quantitation tab in the Data Analysis window.
NOTE: The software links the data in the panes of each data analysis tab. For
example, highlighting a well by placing the mouse pointer over the well in the well
selector view highlights the data in all the other panes.
Step Number Selector
The CFX96 system or CFX384 system can acquire fluorescence data at multiple protocol
steps; the software maintains the data acquired at each step independent. The software
displays the Step Number selector below the Standard Curve chart on the Quantitation tab
whenever a protocol contains more than one data collection step. When you select a step, the
software applies that selection to all the data that are shown in the Data Analysis window.
Figure 73 shows the data collection step number is 3 for all the data.
Figure 73. Step Number selection in the Data Analysis window.