CFX96 and CFX384 Systems Manual
127
• Analysis Mode. Select the default base lining method for the analysis mode. Choose
Baseline Subtracted Curve Fit, No Baseline Subtraction, or Baseline Subtracted
• C(t) Determination Mode. Select between Regression mode or Single Threshold mode
to determine how C(t) values are calculated for each fluorescence trace
• Log View. Select On to show a semi-logarithmic graph of the amplification data. Select
Off to show a linear graph
For the allelic discrimination data, select the following settings:
• Display Mode. Select RFU to show the data as a graph of the RFU, or select Threshold
Cycle to show a graph of threshold cycles
• Normalize Data. This selection is only available when RFU is selected. Select No to
show unnormalized data. Select Yes to normalize the data to the control sample
For the end point data, select the following settings. Select the number of end cycles to
average when calculating the end point calculations:
•PCR. Enter a number of cycles for PCR to average the end cycles for quantitation data
(default is 5)
• End Point Only Run. Enter a number of cycles for End Point Only Run to average the
end cycles for end point data (default is 2)
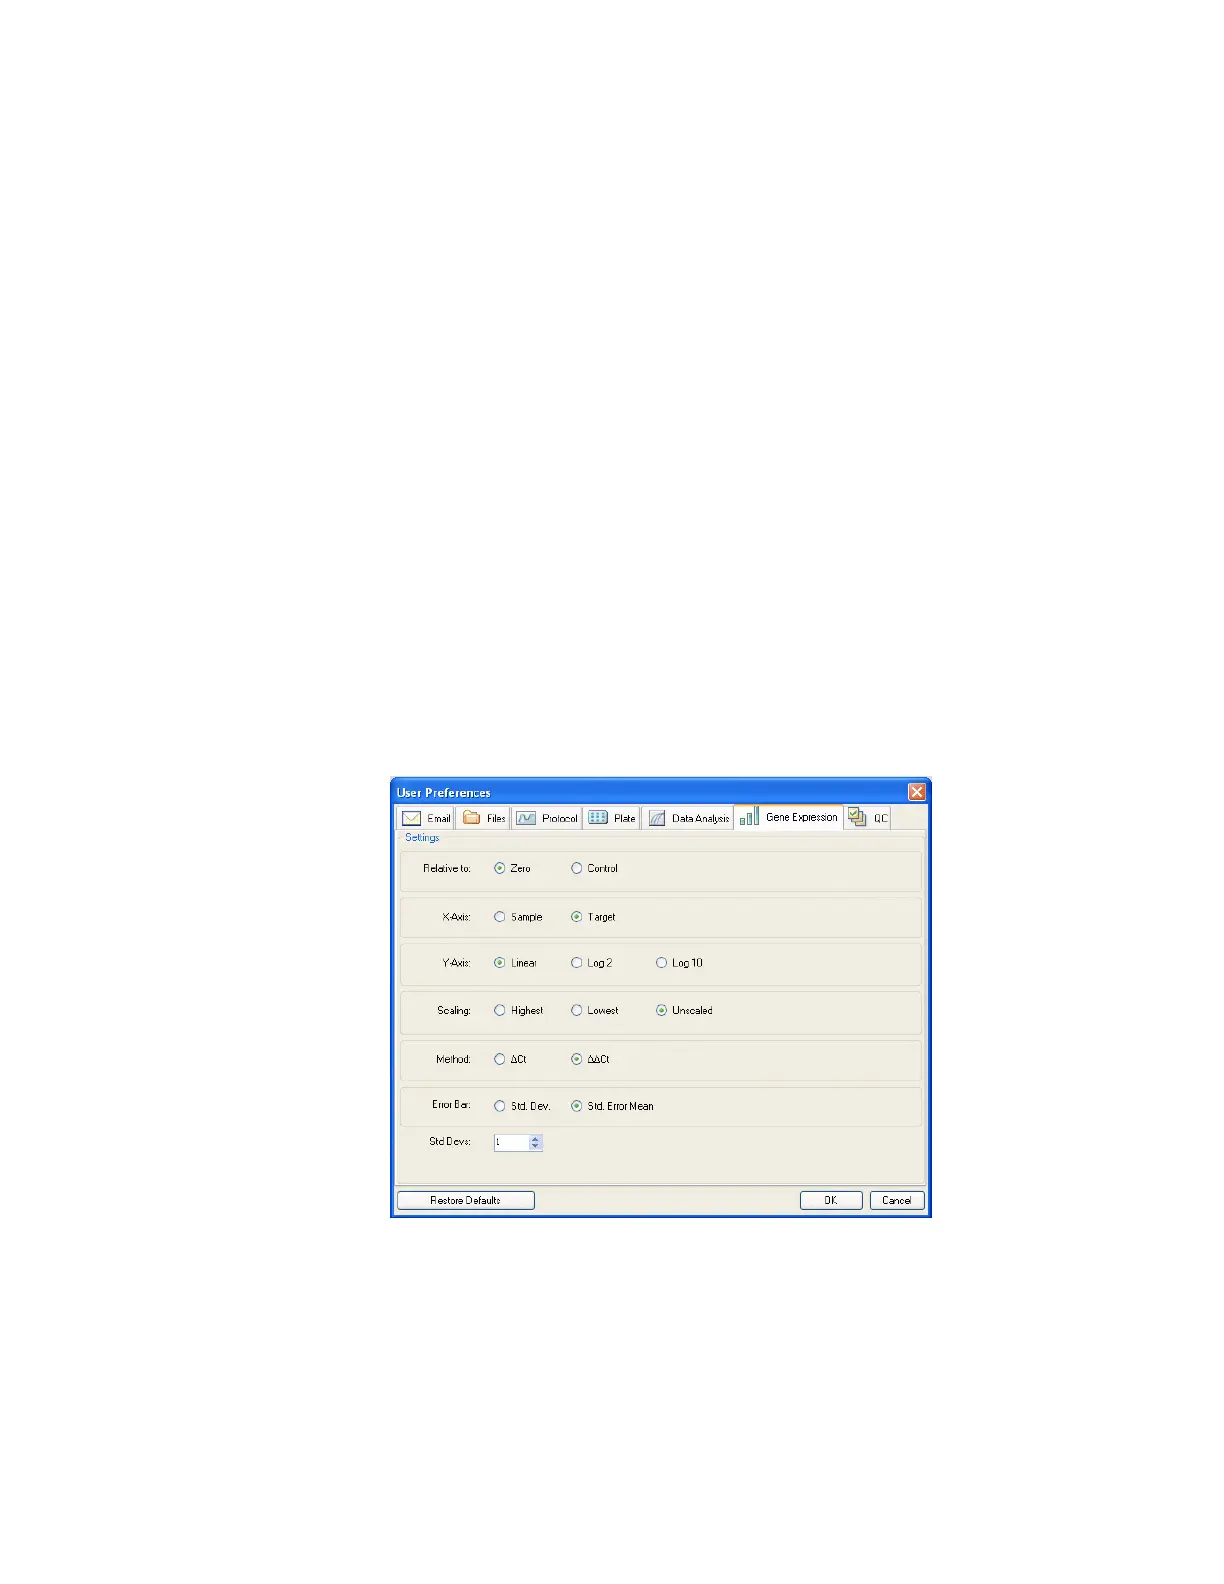
Gene Expression Tab
Select the Gene Expression tab in the User Preferences window to specify the default
settings for a new Gene Expression data file.
Figure 117. Gene Expression tab in the User Preferences window.
Specify the default settings for a new Gene Expression data file:
• Relative to. Select a control or zero. To graph the gene expression data originating at 1
(relative to a control), select Control. When you assign a control sample in the
Experiment Setup window, the software automatically defaults to calculate the data
relative to that control. Select Relative to zero to instruct the software to ignore the