CFX96 and CFX384 Systems Manual
107
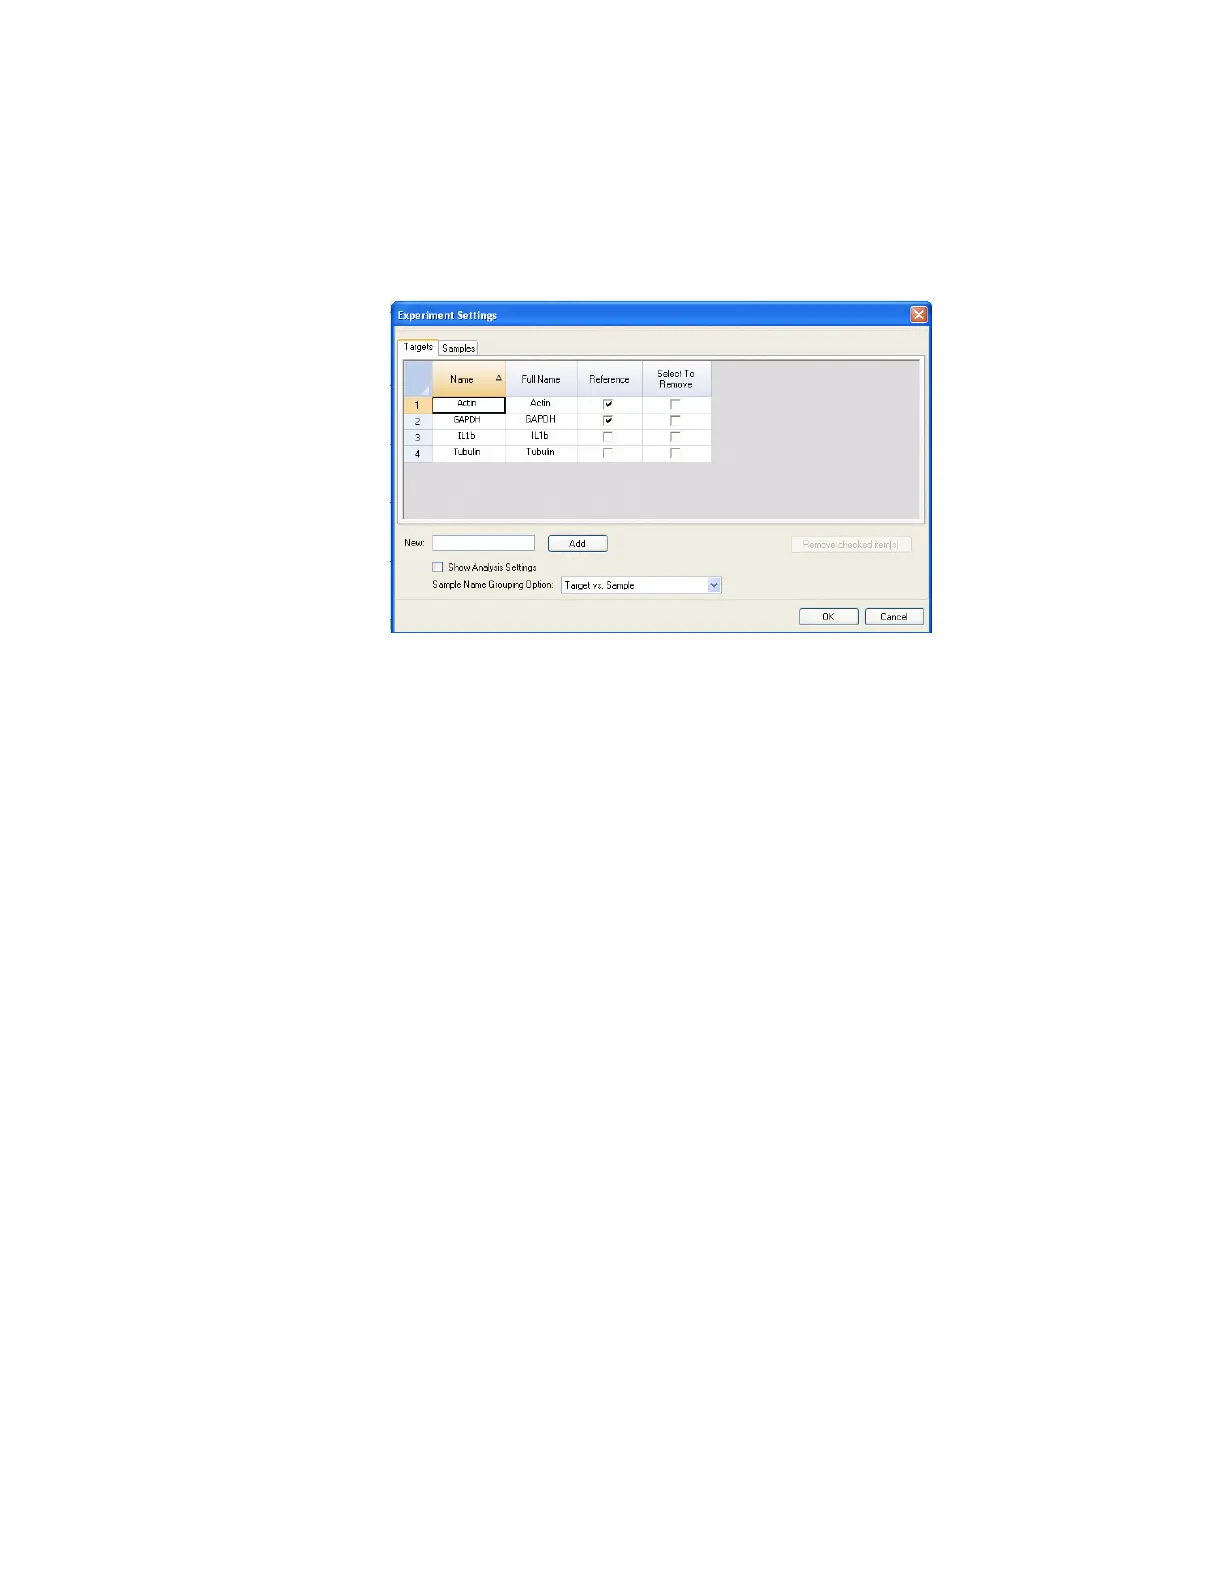
Experiment Settings Window
Open the Experiment Settings window by clicking the Experiment Settings button in the
Gene Expression tab. In this window, view or change the list of Targets and Samples, select
reference genes, select control samples or set the Gene Expression Analysis sample group to
be analyzed if Collection Names have been added to the wells (Figure 101).
Figure 101. Experiment Settings window with Targets tab selected.
To adjust the lists in these tabs, use the following functions:
• Add a target or sample name by typing a name in the New box, and clicking Add
• Remove a target or sample name from the list by clicking the Remove Name box for
that row, and then clicking the Remove checked item(s) button
• Select the target as a reference for gene expression data analysis by clicking the box
in the Reference column next to the Name for that target
• Select the sample as a control sample for gene expression data analysis by clicking
the box in the Control column next to the name for that sample
Sample Name Grouping Option
Loading Collection Names in the wells enables samples to be analyzed in one of four
configurations defined by the Sample Name Grouping Option. These options are available
from the pull-down menu in the Experiment Settings tab.
• Target vs. Sample. Only the well sample name is used in the gene expression
calculations
• Target vs. Collection. Only the well collection name is used in the calculations
• Target vs. Sample_Collection. The sample name and collection name are combined to
make a single name that is used in the calculations
• Target vs. Collection_Sample. The collection name and sample name are combined to
make a single name that is used in the calculations
Show Analysis Settings in Experiment Settings
Click the Show Analysis Settings box in the Experiment Settings window to view or change
analysis parameters applied in the Gene Expression tab:
• Click a cell in the Color column to change the color of the targets graphed in the
Gene Expression chart