CFX96 and CFX384 Systems Manual
73
Viewing Well Groups in Data Analysis
Wells in the plate can be grouped into subsets for independent analysis using well groups.
When you create well groups in the Well Groups Manager window in the Plate Editor
(page 50), group names appear in the Data Analysis window within the Well Groups list on the
toolbar.
TIP: To open the Plate Editor, click the View/Edit Plate button in the Data Analysis
window toolbar.
By default, the well group All Wells is selected when the Data Analysis Window is first opened,
with the data in all wells with content shown in the charts and spreadsheets.
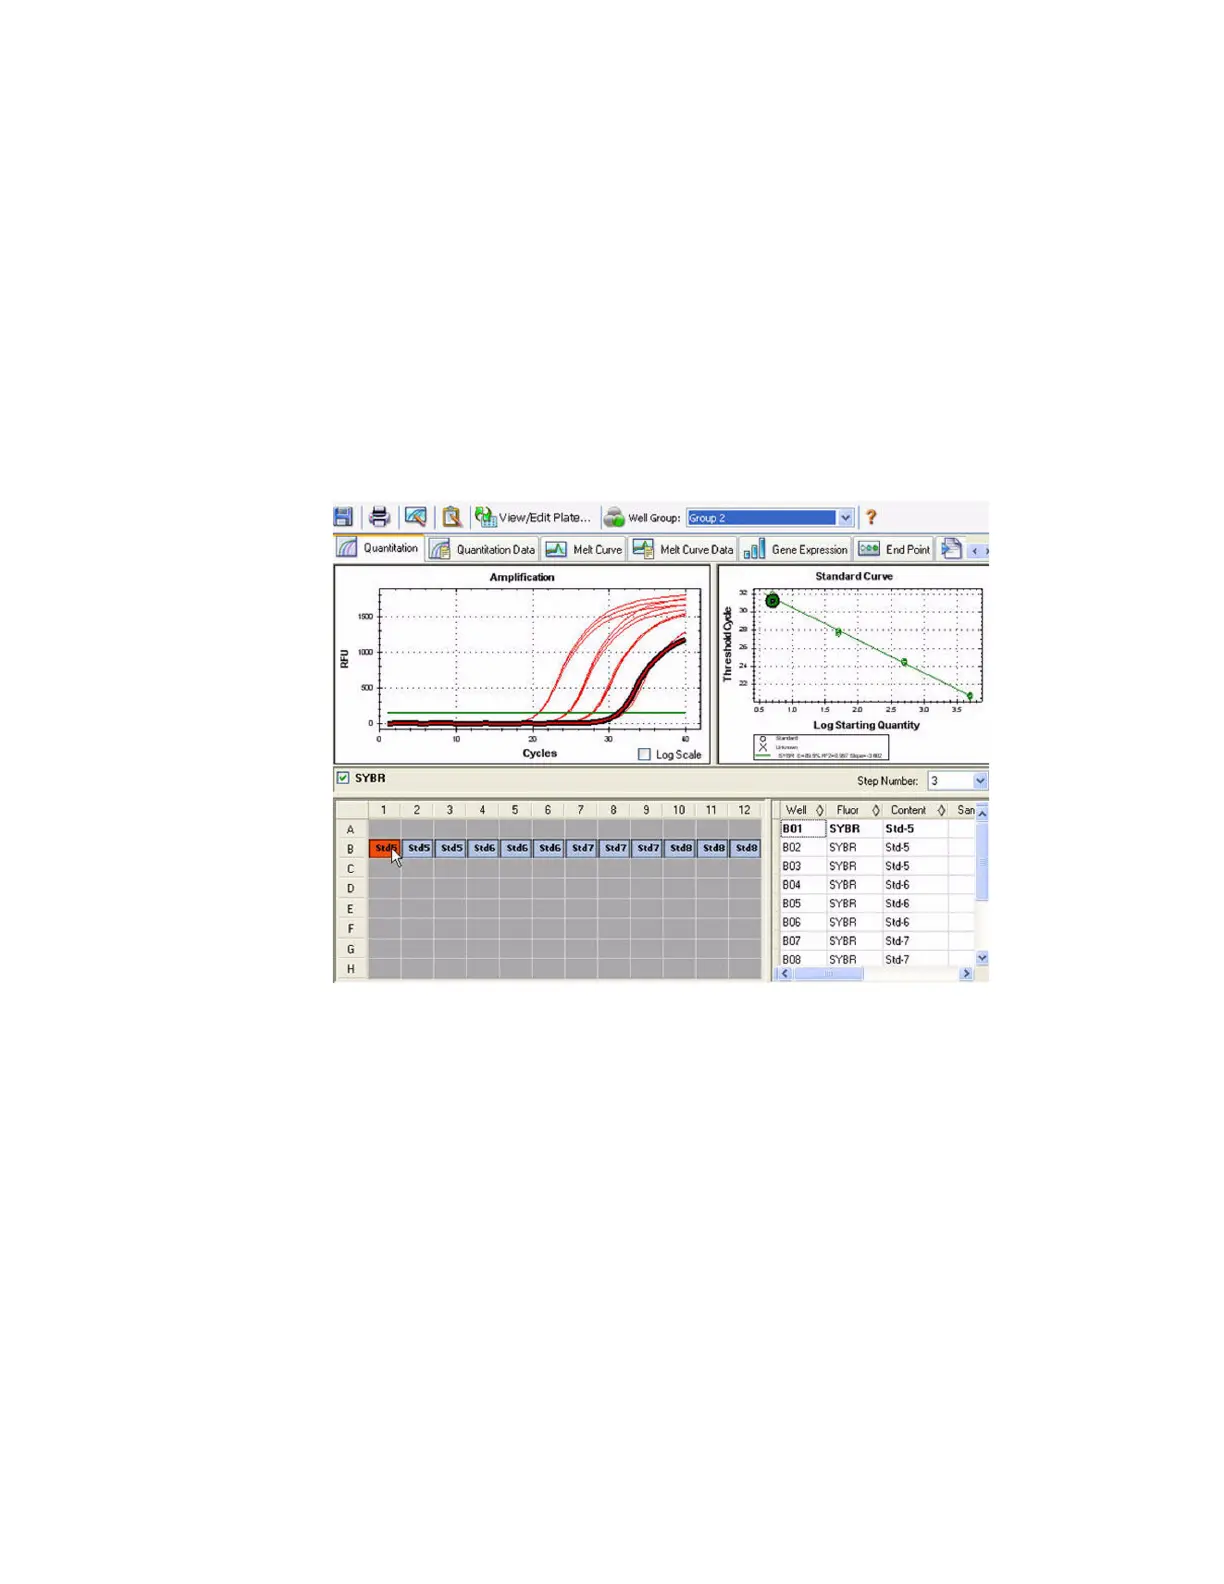
Figure 74 shows Group 2 selected in the Well Groups menu. Only the wells in that well group
appear loaded with content in the well selector and data only for these wells are included in
the data analysis calculations.
Figure 74. Data Analysis window with Group 2 selected.
Data Analysis Settings
The Amplification chart data in the Quantitation tab shows the relative fluorescence (RFU) for
each well at every cycle. Each trace in the chart represents data from a single fluorophore in
one well. These data are used to determine C(t) values for each well on a per fluorophore
basis. The software uses one of two modes to determine C(t) values:
•Regression. This mode applies a multivariable, nonlinear regression model to individual
well traces and then uses this model to compute an optimal C(t) value
• Single Threshold. This mode uses a single threshold value to calculate the C(t) value
based on the threshold crossing point of individual fluorescence traces