CFX96 and CFX384 Systems Manual
113
Show Details Data
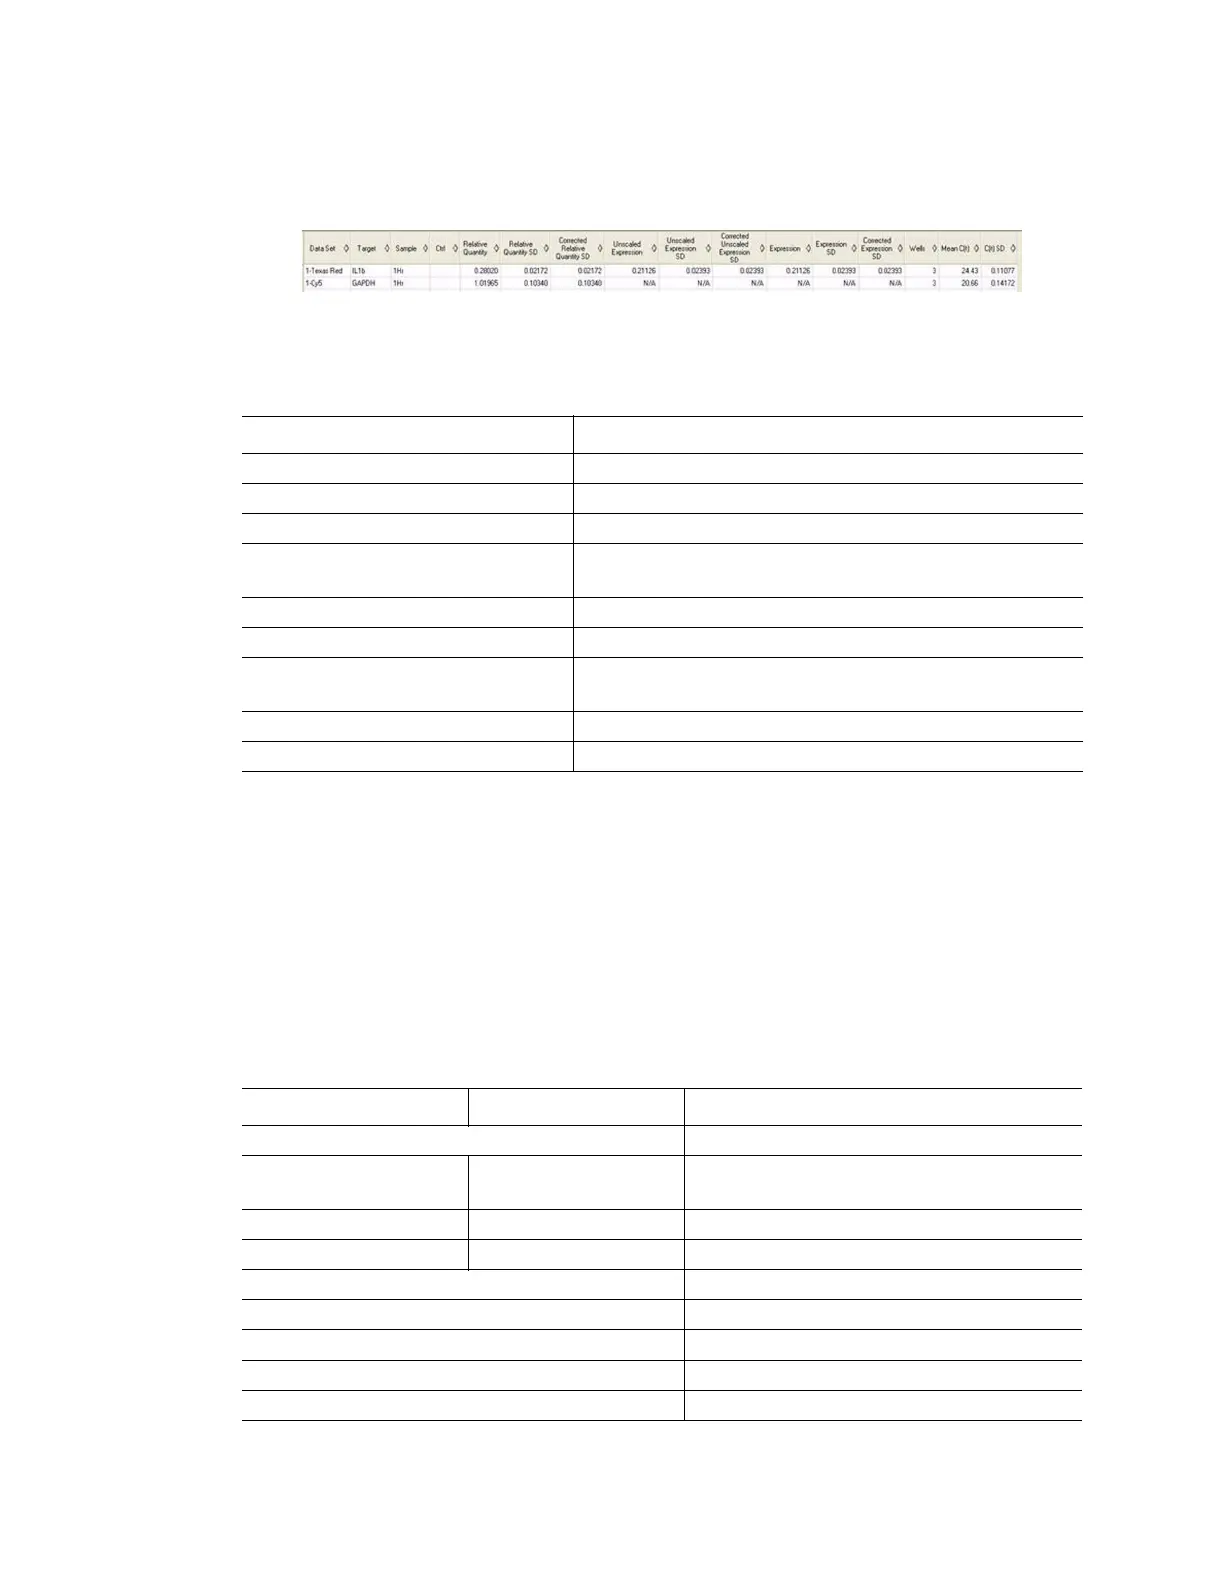
Click the Show Details check box to show additional information (Figure 106).
Figure 106. Show Details data in the Gene Study tab.
The spreadsheet adds the information in the columns listed in Table 42.
Gene Study Report Window
Open the Gene Study Report window to arrange the Gene Study data into a report. To create a
gene study report, follow these steps:
1. Adjust the Gene Study report data and charts as needed before creating a report.
2. Select Tools > Reports to open the Gene Study report window.
3. Click the check boxes in the report options list to select and remove options to choose
the data to display. Select the options shown in Table 43.
Table 42. Information added to the spreadsheet when Show Details selected
Information Description
Data Set Fluorescence data from one fluorophore in one data file
Relative Quantity Calculated relative quantity of samples
Relative Quantity SD Standard deviation of the relative quantity calculation
Corrected Relative Quantity SD Calculated standard deviation of the corrected relative
quantity
Unscaled Expression Calculated unscaled expression
Unscaled Expression SD Calculated standard deviation unscaled expression
Corrected Unscaled Expression SD Corrected standard deviation of the unscaled
expression
Expression Relative expression
Wells Well number in the plate
Table 43. Categories for a Gene Study report
Category Option Description
Header Title, subtitle and logo for the report
Report Information Date, user name, data file name, data file
path, and the selected well group
Gene Study File List List of all the data files in the Gene Study
Notes Notes about the data report
Analysis Parameters A list of the selected analysis parameters
Chart Gene Expression chart showing the data
Tar g e t N a me s List of targets in the Gene Study
Sample Names List of samples the Gene Study
Data Spreadsheet that shows the data