CFX96 and CFX384 Systems Manual
71
Data Analysis Menu Bar
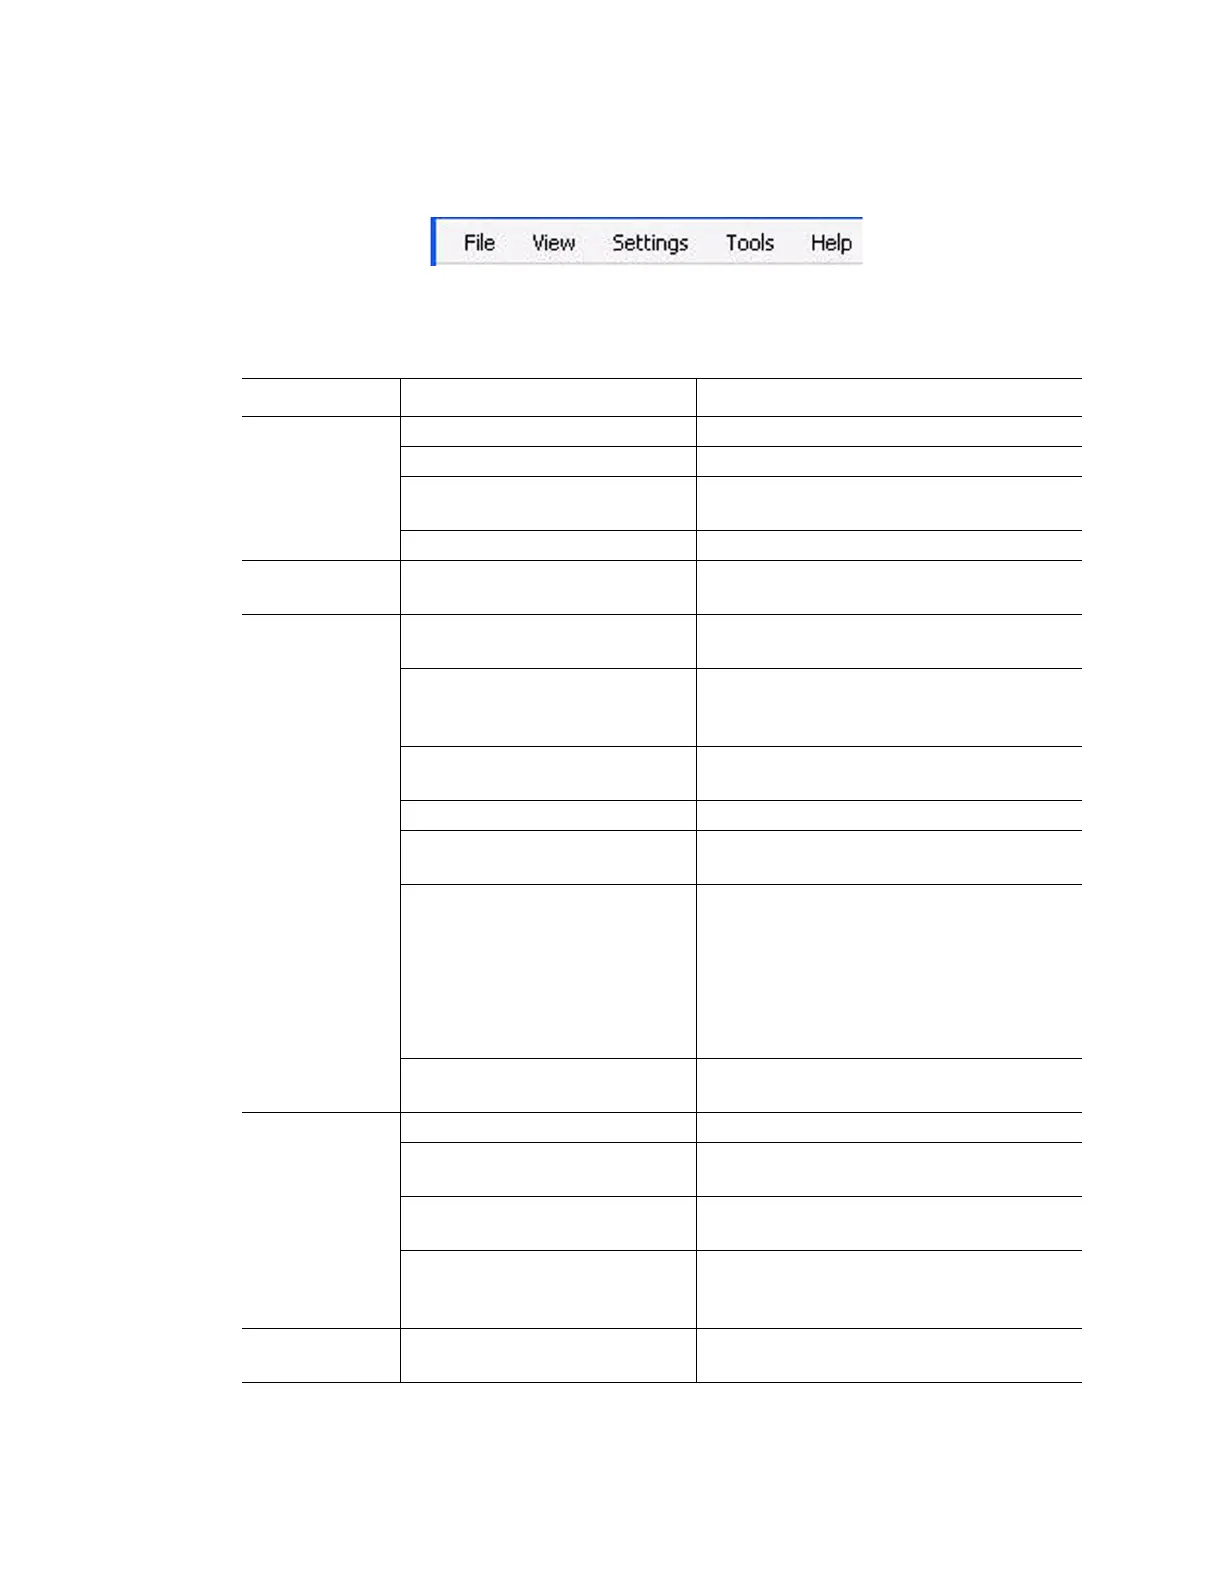
The menu bar in the Data Analysis window (Figure 71) provides these menu items:
Figure 71. Menu bar in the Data Analysis window.
Table 20 lists the functions of items in the menu bar.
Table 20. Menu bar items in Data Analysis window
Menu Item Command Function
File Save Save the file
Save As Save the file with a new name
Repeat Experiment Extract the protocol and plate file from the
current experiment to rerun it
Exit Exit the Data Analysis window
View Run Log Open a Run Log window to view the run
log of those data file
Settings Analysis Mode Select Baseline Subtraction method for
the selected well groups in the data
C(t) Determination Mode Select Regression or Single-Threshold
mode to determine how C(t) values are
calculated for each trace
Baseline Thresholds Open the Baseline Thresholds window to
adjust the baseline or the threshold
Trace Styles Open the Trace Styles window
View/Edit Plate Open the Plate Editor to view and edit the
plate
Mouse Highlighting Turn on or off the simultaneous
highlighting of data with the mouse
pointer
TIP: If the Mouse Highlighting is turned off,
then hold down the Control key to
temporarily turn on the highlighting
Display Threshold Values Display the value of the threshold line in
the chart
Tools Reports Open the Report for this data file
Import Fluorophore Calibration Select a calibration file to apply to the
current data file
Replace Plate Replace the current plate file in the data
analysis
Export All Data Sheets to Excel Export all the spreadsheet views from
every tab to a separate Excel formatted
file
Help Open software Help for more information
about data analysis
 Loading...