Data Analysis Overview
70
The Data Analysis window displays up to nine tabs (Figure 69). Each tab shows the analyzed
data for a specific analysis method:
Figure 69. All the tabs that can display in the Data Analysis window.
The software only displays a tab in the Data Analysis window if the data are collected in the
run and data are available for that type of analysis. For example, the Melt Curve and Melt
Curve Data tabs do not appear if the experiment does not include a melt curve step.
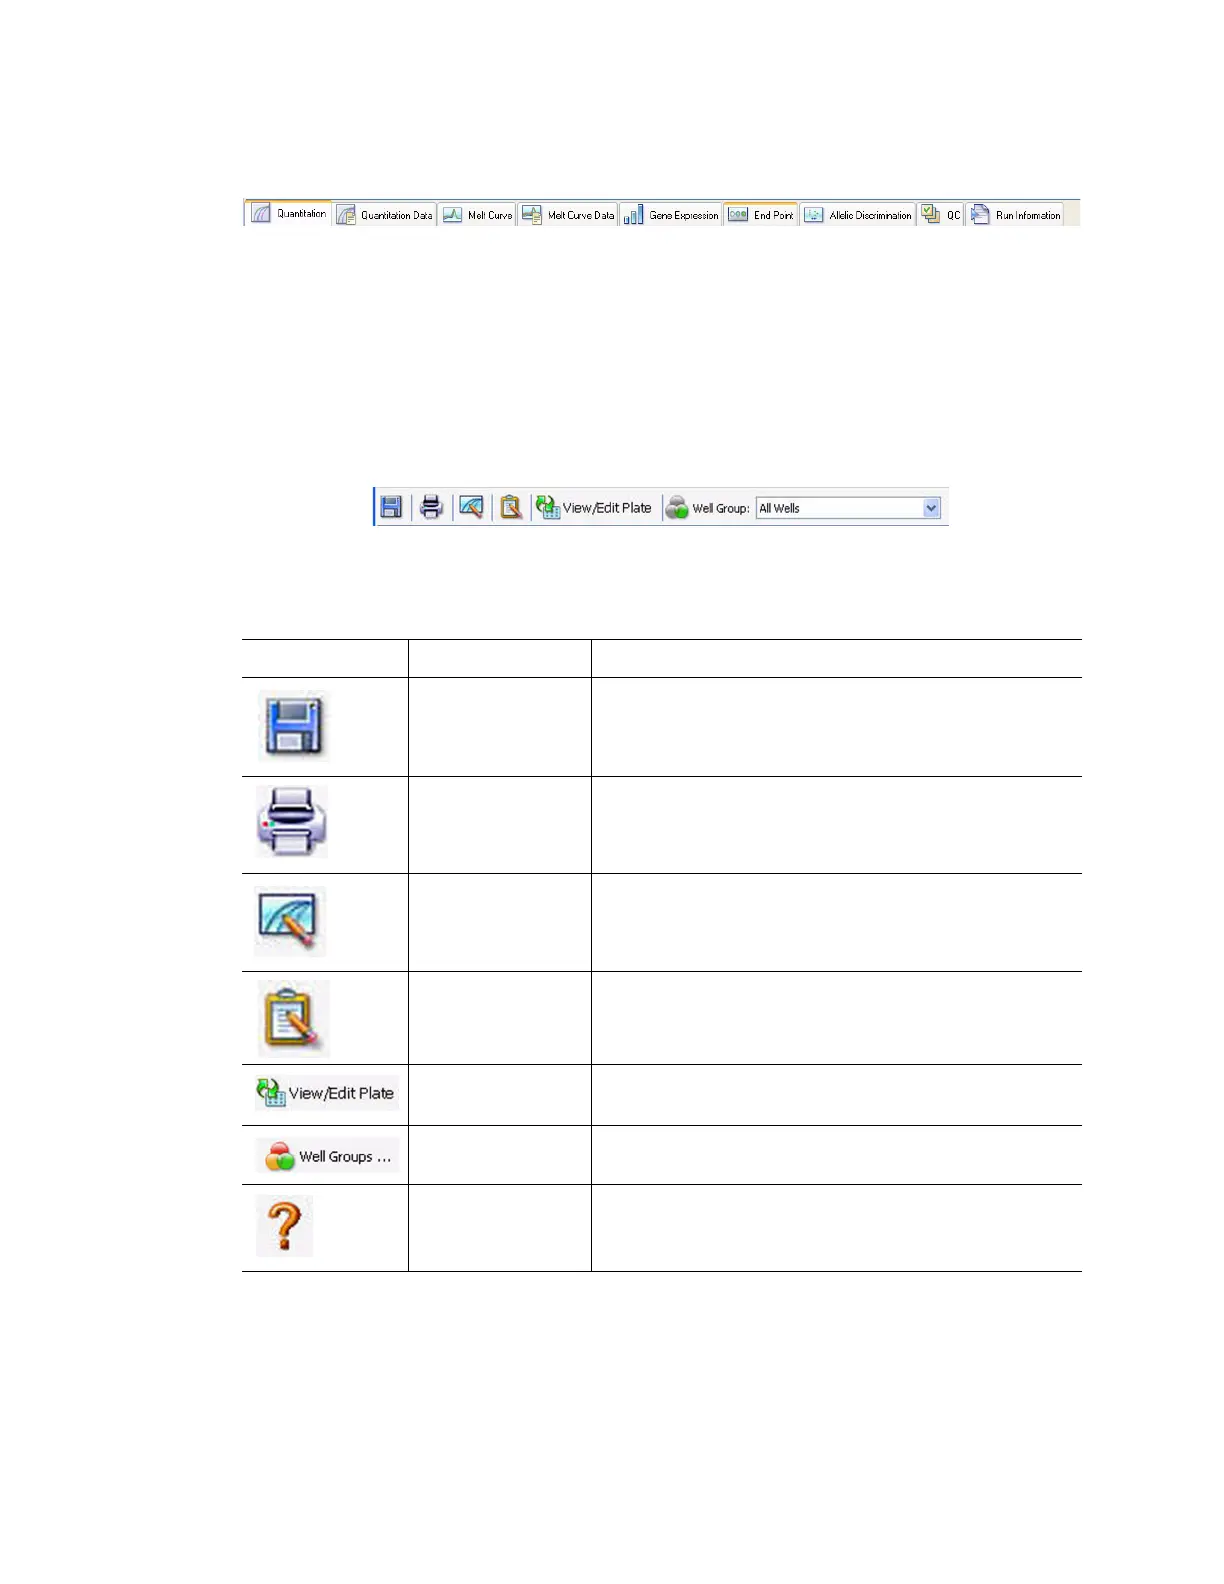
Data Analysis Toolbar
The toolbar in the Data Analysis window (Figure 70) provides quick access to important data
analysis functions.
Figure 70. Toolbar in the Data Analysis window.
Table 19 lists the functions of buttons in the toolbar.
Table 19. Toolbar in the Data Analysis window
Toolbar button Name Function
Save Save the current data file
Print Print the selected window
Trace Style Open Trace Style window
Report Open a Report for the current data file
View/Edit Plate Open the Plate Editor to view and edit the contents of
the wells
Well Groups... Select a well group name from the pull-down menu.
The default selection is All Wells
Help Open the software Help site for more information
about data analysis