CFX96 and CFX384 Systems Manual
85
Quantitation tab Spreadsheet
Table 25 shows the type of data shown in the spreadsheet at the bottom right side of the
Quantitation tab:
TIP: To make changes to the Content and Sample, open the Plate Editor by clicking
the View/Edit Plate button.
Quantitation Data Tab
The Quantitation Data tab shows spreadsheets that describe the quantitation data collected in
each well. Select one of the three options to show the data in different formats:
• Results. Displays a spreadsheet view of the data
•Plate. Displays a view of the data in each well as a plate map
•RFU. Choose this spreadsheet to show the RFU quantities in each well for each cycle
TIP: Right-click any spreadsheet for options, including the sort option.
Results Spreadsheet
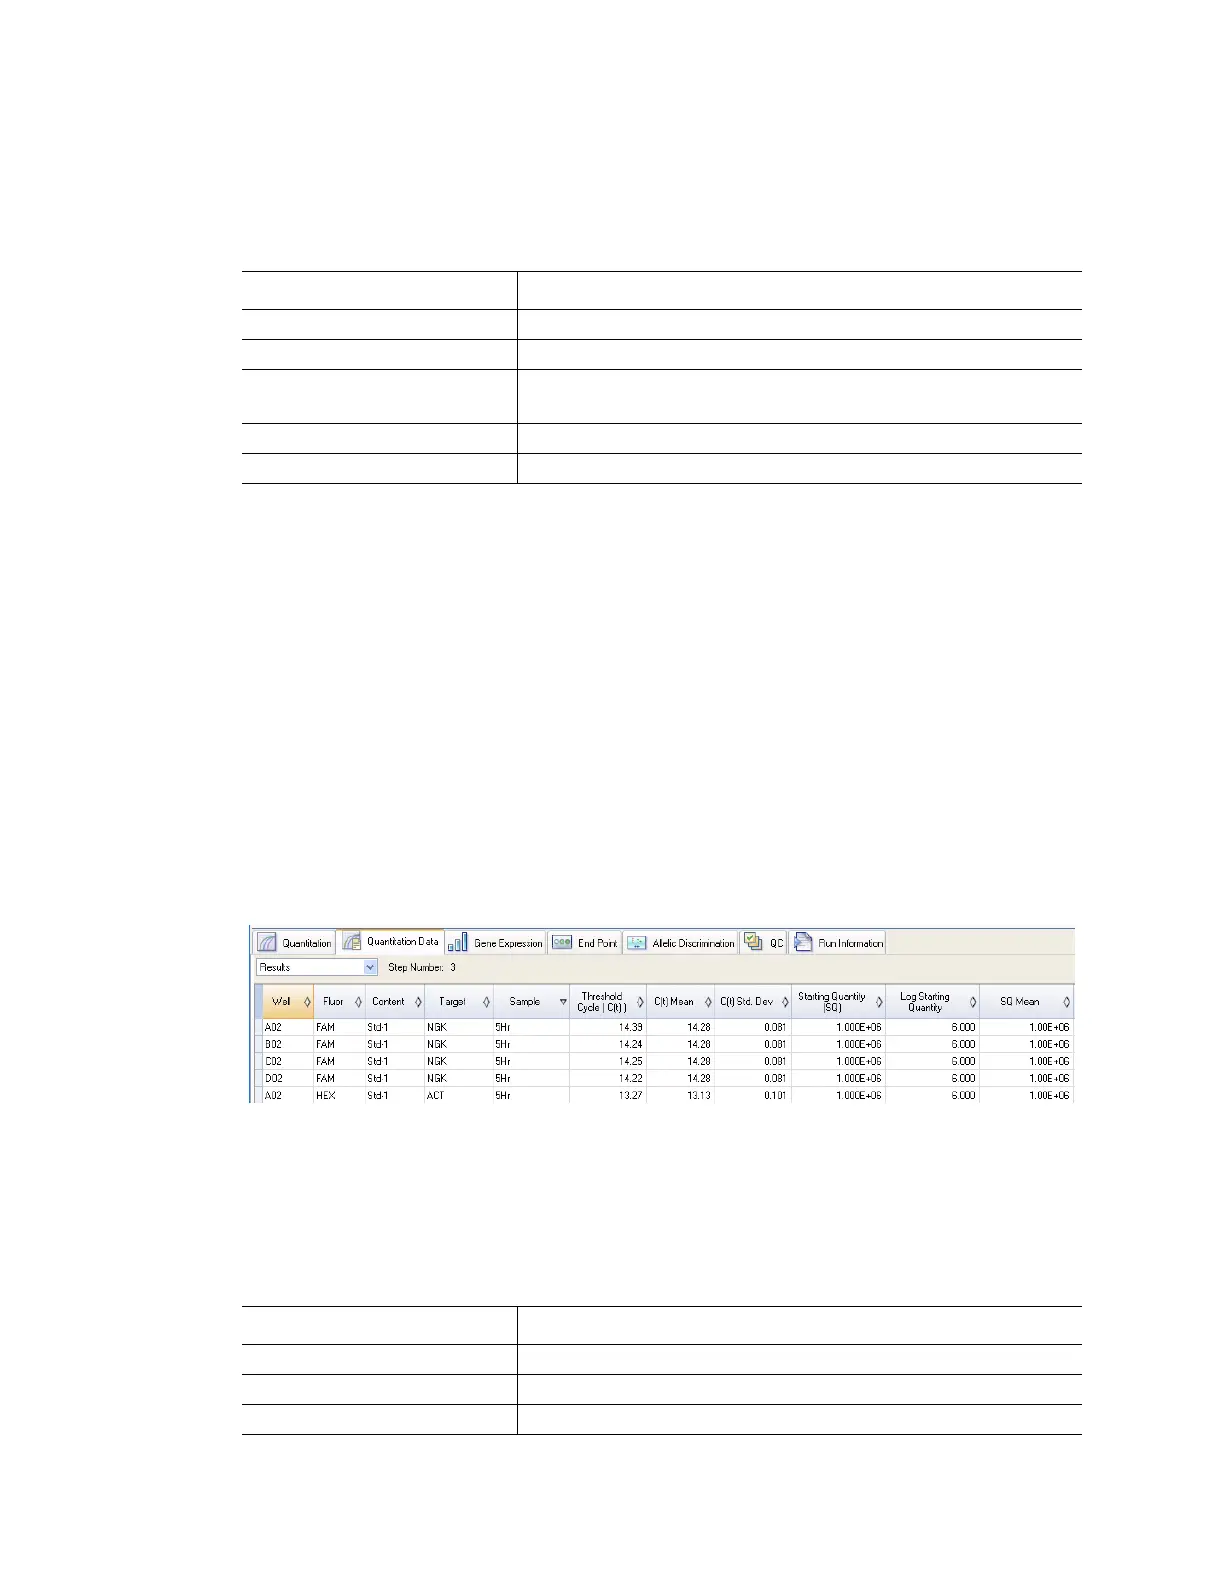
Select a Results spreadsheet (Figure 85) to see data for each well in the plate.
Figure 85. Quantitation Data tab with Results spreadsheet selected.
NOTE: All Std. Dev (standard deviation) calculations apply to the replicate groups
assigned in the wells in the Plate Editor window. The calculations average the C(t)
value for each well in the replicate group.
The Results spreadsheet includes the type of information listed in Table 26.
Table 25. Quantitation tab spreadsheet content
Information Description
Well Well position in the plate
Fluor Fluorophore detected
Content A combination of the Sample Type (required) and Replicate #
(optional) loaded in the Plate Editor
Sample Sample Name loaded in the Plate Editor wells
C(t) Threshold cycle for each trace
Table 26. Results spreadsheet content
Information Description
Well Well position in the plate
Fluor Fluorophore detected
Content Sample type and replicate number