Data Analysis Windows
84
Standard Curve Chart
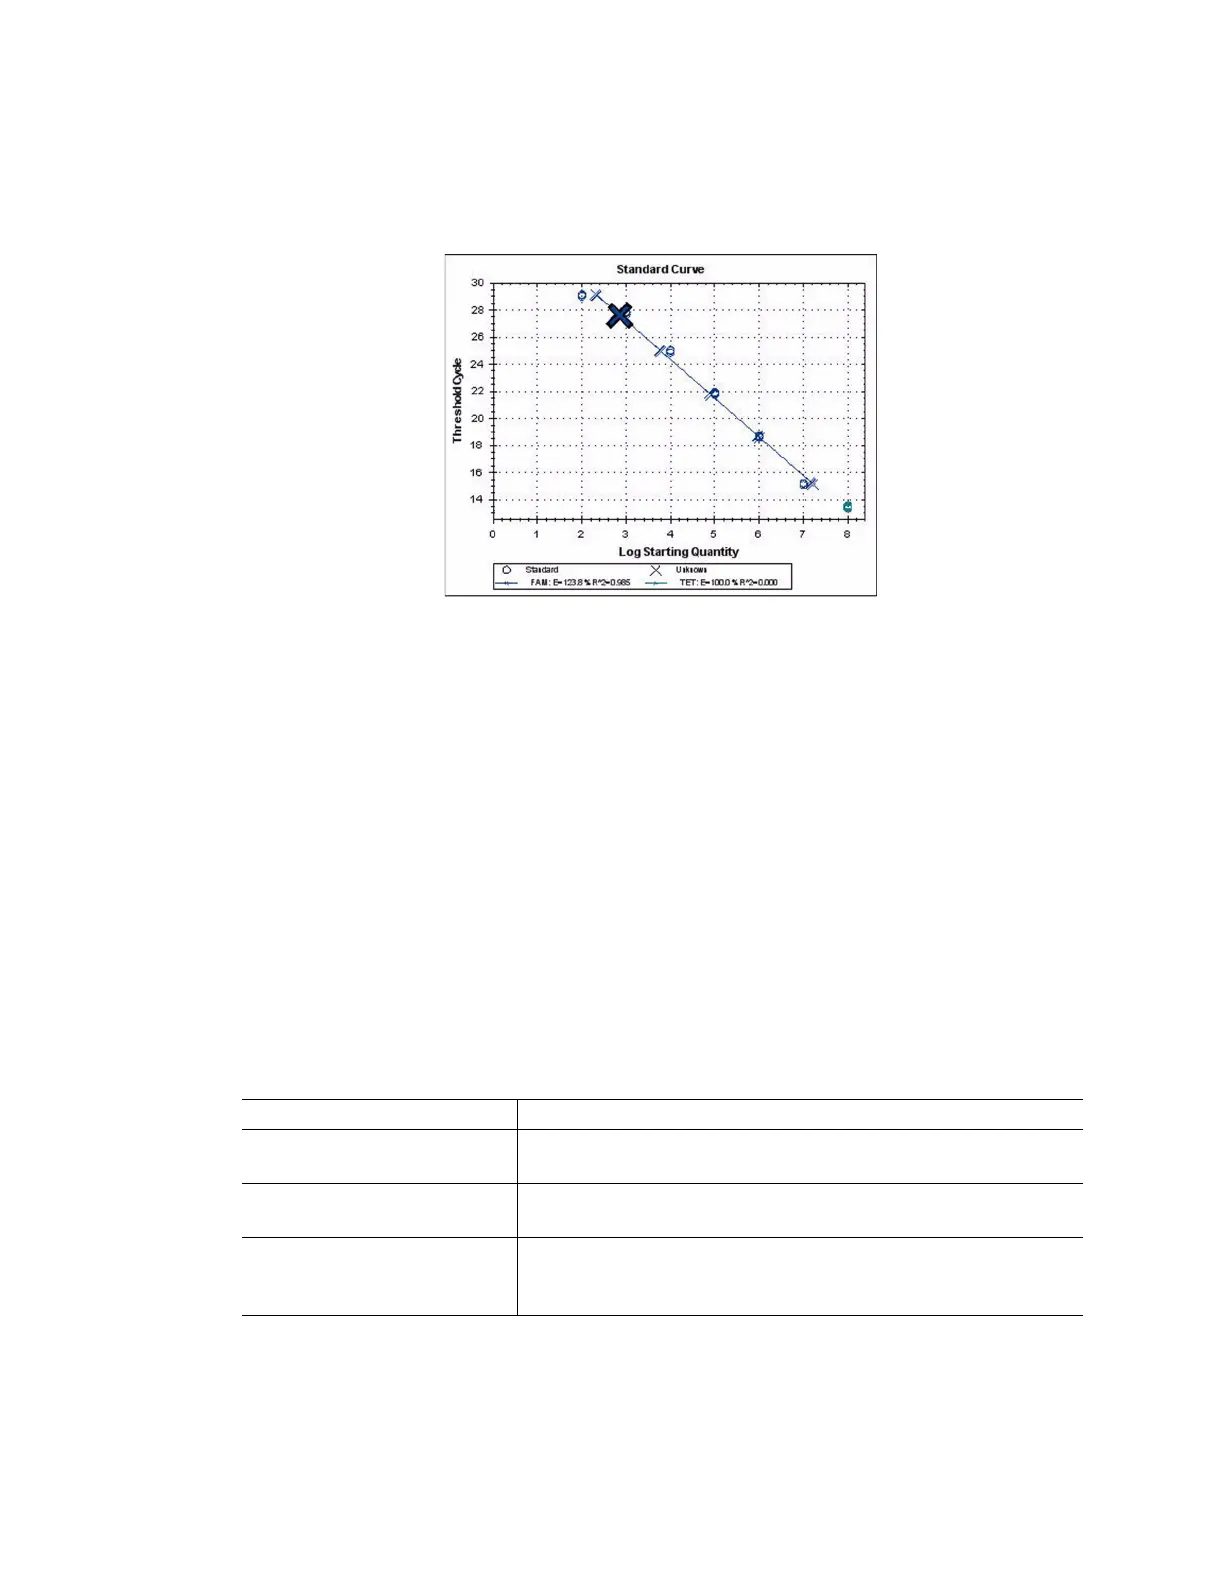
The software creates a Standard Curve chart (Figure 84) in the Quantitation tab if the data
include sample types defined as standard (Std) for one fluorophore in the experiment.
Figure 84. Standard Curve chart.
The Standard Curve chart displays the following information:
• Name for each curve (the fluorophore name)
• Color of each fluorophore
• Reaction efficiency (E). Use this statistic to optimize a multiplex reaction, and
equalize the data for a standard curve
NOTE: The reaction efficiency describes how much of your target is being
produced with each cycle in the protocol. An efficiency of 100% means that you
are doubling your target with each cycle.
• Coefficient of determination, R
2
(written as R^2). Use this statistic to determine how
correctly the line describes the data (goodness of fit)
Chart Right-Click Menu Options
In addition to the common right-click menu options to copy, print and export charts, Table 24
lists the menu options available only on the Amplification chart.
Table 24. Amplification chart specific right-click menu options
Menu Option Function
Show Threshold Values Display the threshold value for each amplification curve on the
chart
Trace Styles... Open the Trace Styles window to change trace styles that
appear on the Quantitation and Melt Curve tabs
Baseline Thresholds... Open the Baseline Thresholds window to change baseline or
thresholds of each fluorophore (changes appear in
Amplification chart in Quantitation tab)