CFX96 and CFX384 Systems Manual
89
Melt Curve Data Tab
The Melt Curve Data tab shows the data from the Melt Curve tab in multiple spreadsheets that
include all the melt peaks for each trace. Select one of these four options to show the melt
curve data in different spreadsheets:
• Melt Peaks. List all the data, including all the melt peaks, for each trace
•Plate. List a view of the data and contents of each well in the plate
•RFU. List the RFU quantities at each temperature for each well
• -d(RFU)/dT. List the negative rate of change in RFU as the temperature (T) changes. This
is a first regression plot for each well in the plate
Melt Peaks Spreadsheet
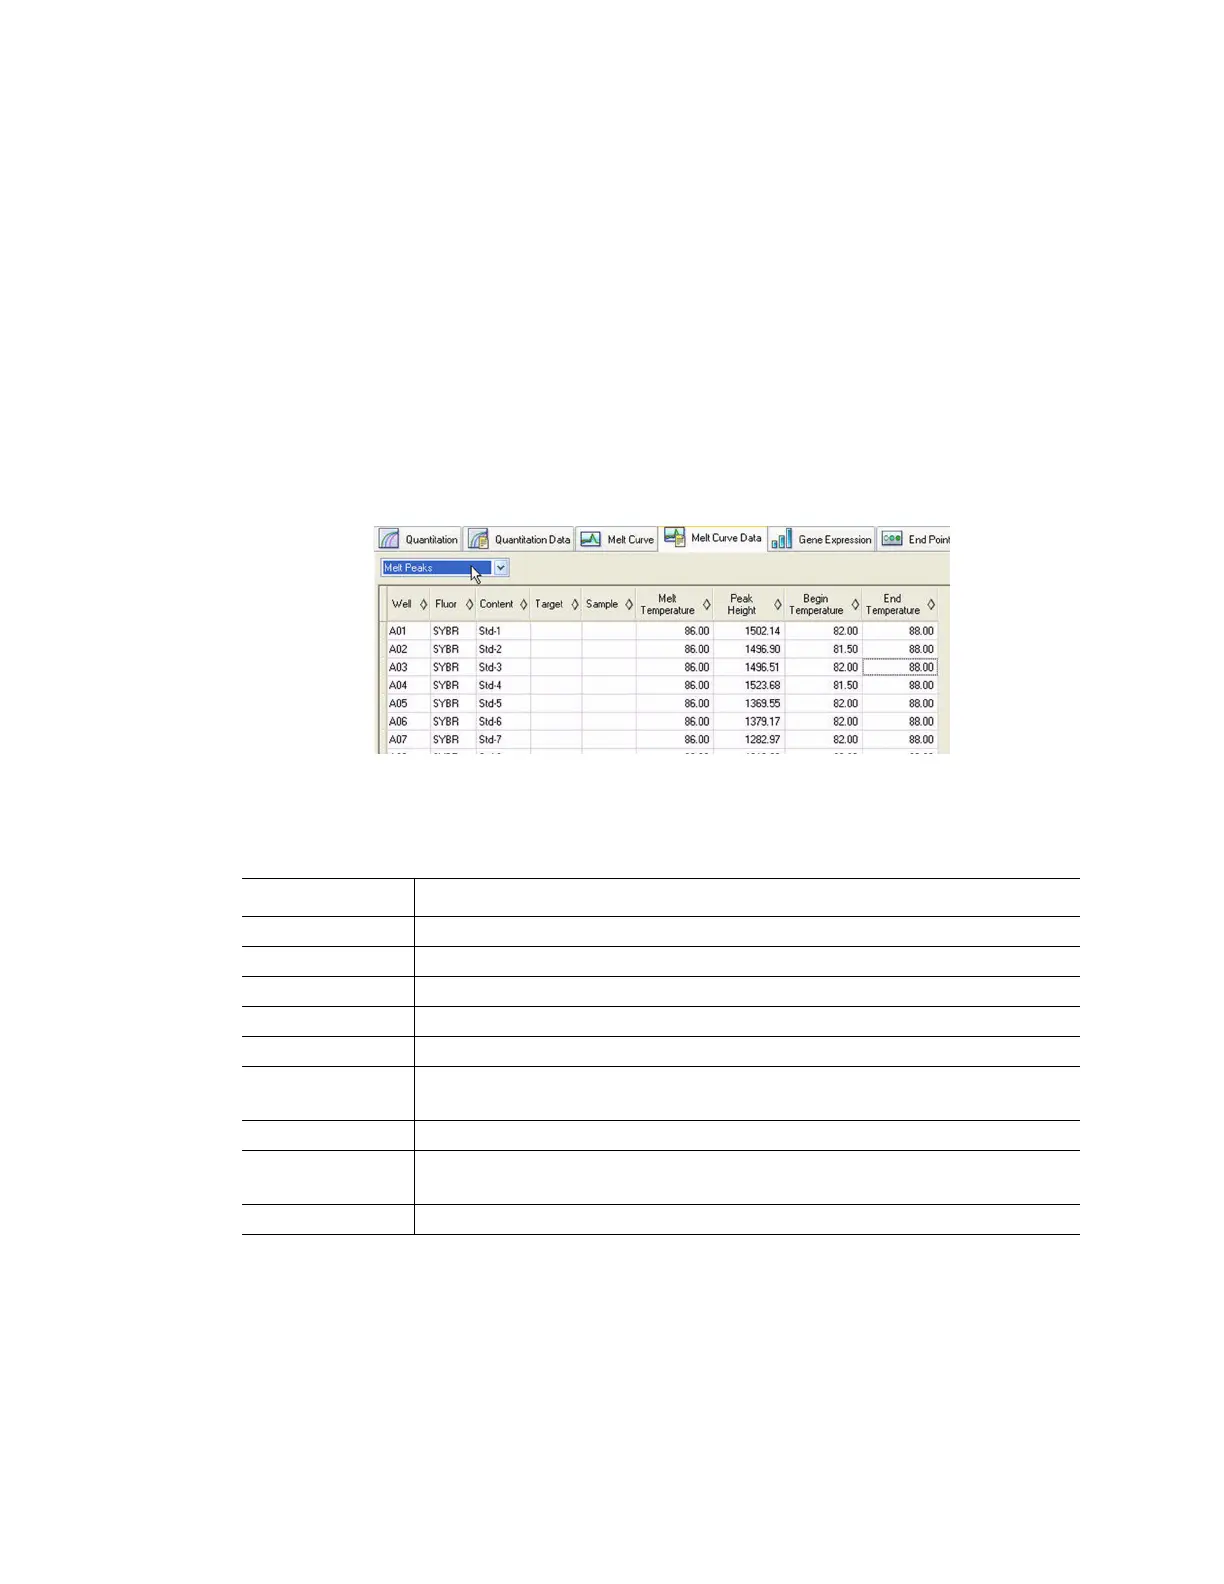
Select the Melt Peaks spreadsheet (Figure 89) to view melt curve data.
Figure 89. Melt Peaks spreadsheet in Melt Curve Data tab.
The Melt Peaks spreadsheet (Figure 89) includes the type of information shown in Table 30.
Table 30. Melt Peaks spreadsheet content
Information Description
Well Well position in the plate
Fluor Fluorophore detected
Content Sample Type listed in the Plate Editor window
Target Amplification target (gene)
Sample Sample Name listed in the Plate Editor window
Melt Temperature The melting temperature of each product, listed as one peak (highest) per
row in the spreadsheet
Peak Height Height of the peak
Begin
Temperature
Temperature at the beginning of the peak
End Temperature Temperature at the end of the peak