Data Analysis Windows
88
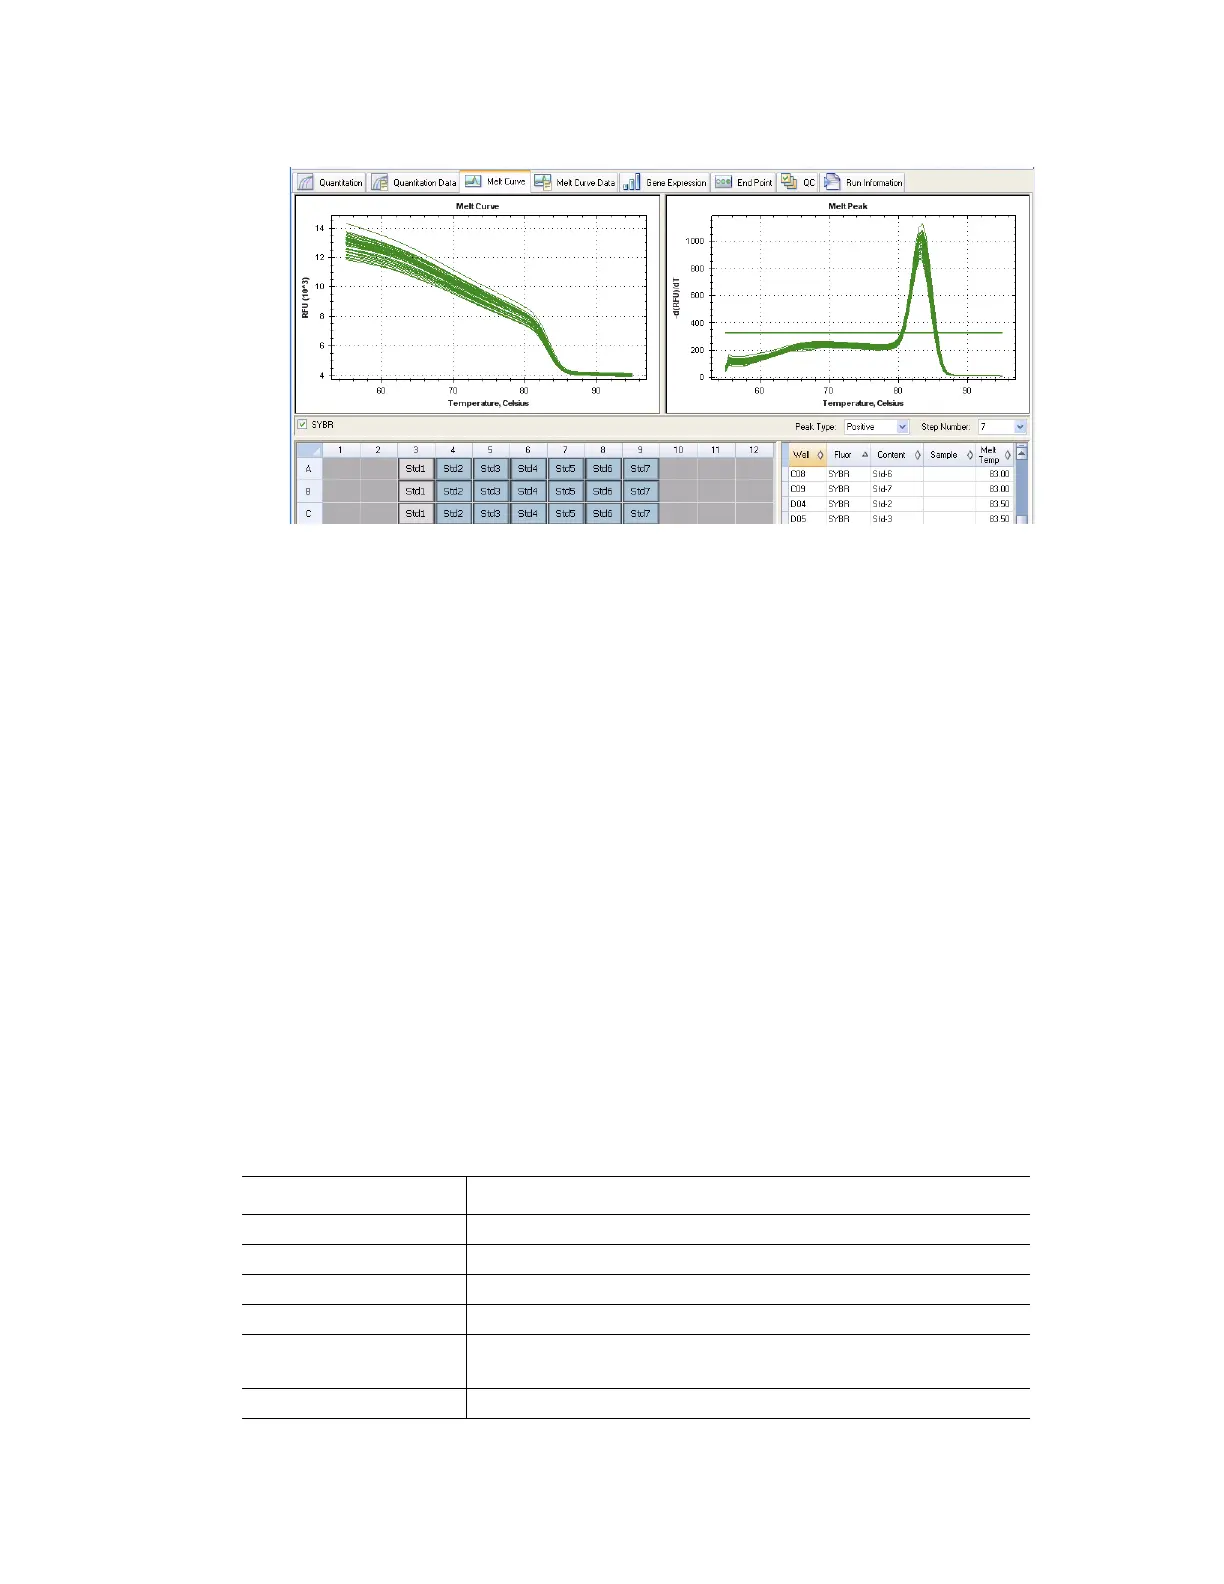
Figure 88. Layout of the Melt Curve tab in the Data Analysis window.
Adjusting Melt Curve Data
Adjust the Melt Curve data by any of these methods:
• Click and drag the threshold bars in the Melt Peak chart to include or exclude peaks
in data analysis
•Select Positive in the Peaks pull-down menu to show the spreadsheet data for the
peaks above the Melt Threshold line, or select Negative to view the spreadsheet
data for the peaks below the Melt Threshold line
• Open the Trace Styles window to change the color of the traces in Melt Curve and
Melt Peak charts.
• Select a number in the Step Number selector (page 82) to view the Melt Curve data
at another step in the protocol. The list shows more than one step if the protocol
includes plate read (camera icon) in two or more melt curve steps
• Select wells in the well selector to focus on subsets of the data
• Select a well group (page 73) to view and analyze a subset of the wells in the plate.
Select each well group by name in the Well Group pull-down menu in the toolbar
Melt Curve tab Spreadsheet
Table 29 shows the type of information in the spreadsheet at the bottom right side of the Melt
Curve tab.
Table 29. Melt Curve tab spreadsheet contents
Information Description
Well Well position in the plate
Fluor Fluorophore detected
Content A combination of Sample Type and Replicate #
Sample Sample Name loaded in the Plate Editor
Melt Temp The temperature of the melt peak for each well. Only the two
highest peaks are displayed in this spreadsheet.
Peak Height The highest point of the melt peak (-d(RFU)/dT)