Data Analysis Windows
86
Plate Spreadsheet
Select the Plate spreadsheet to see a plate map of the data for one fluorophore at a time.
Select each fluorophore by clicking a tab at the bottom of the spreadsheet. Figure 86 shows
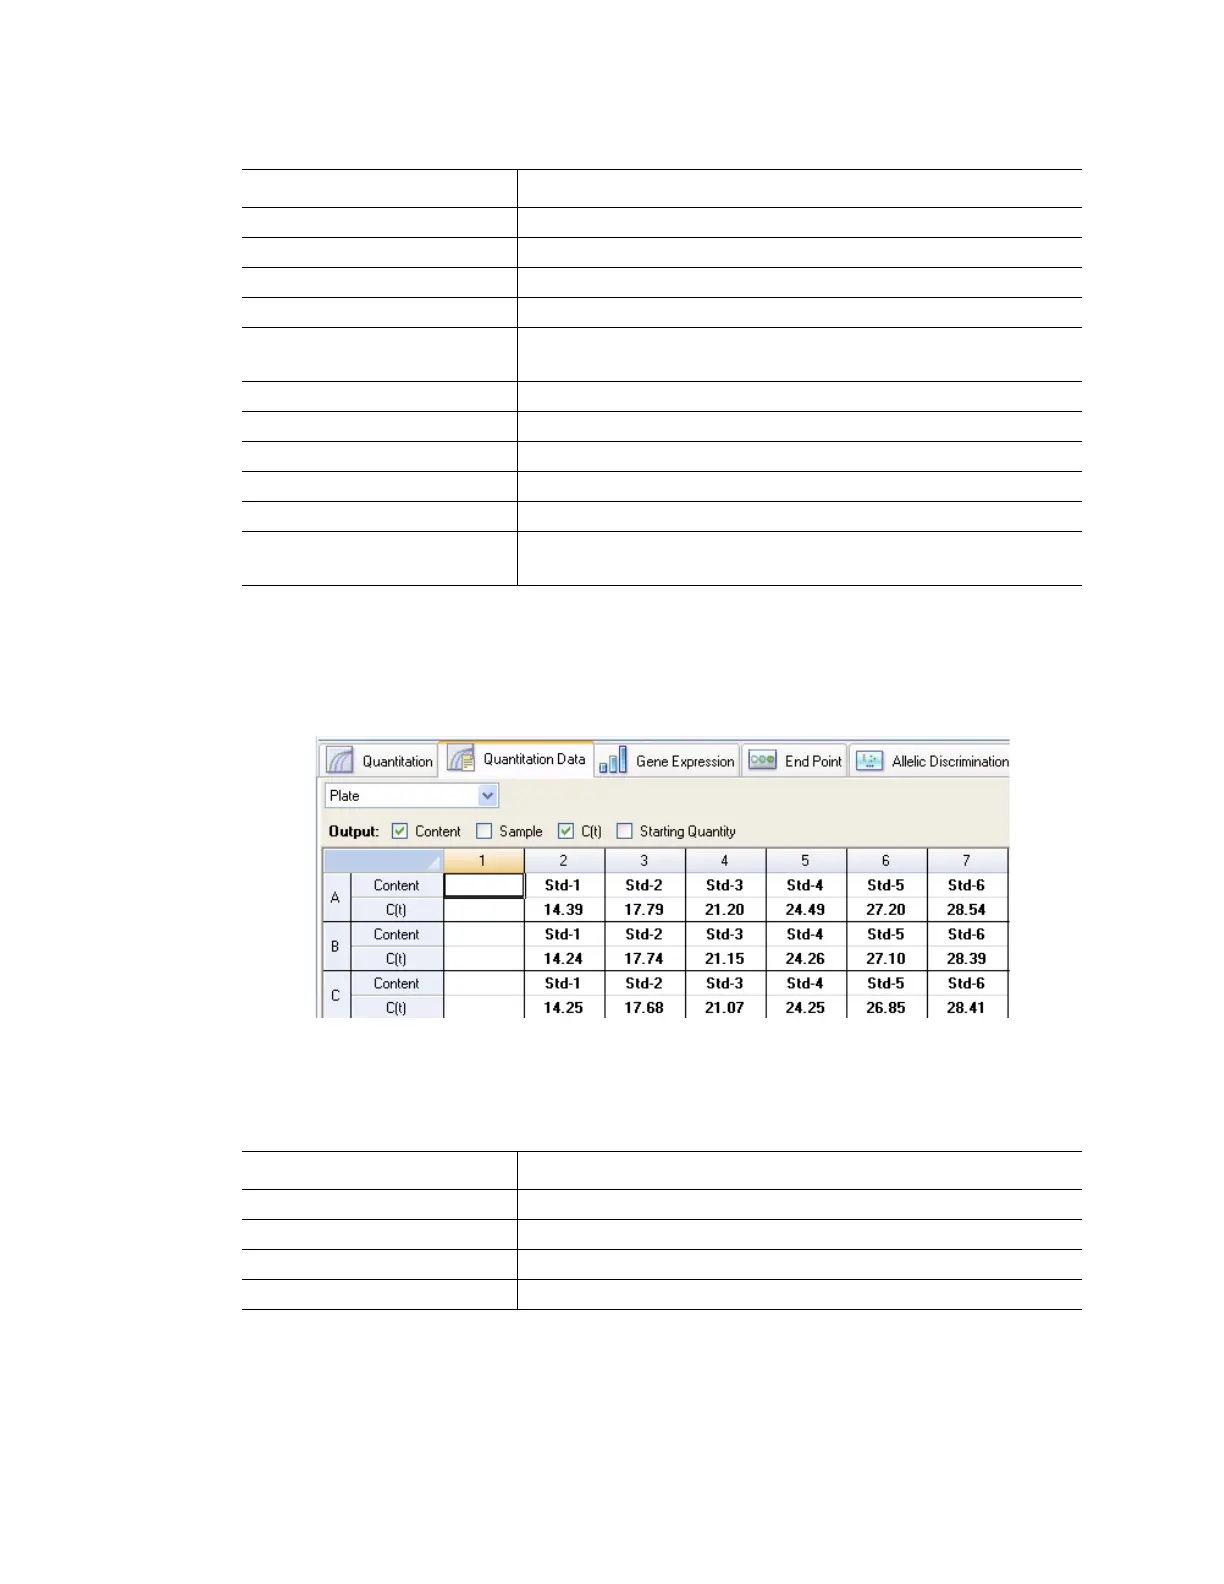
the Plate spreadsheet as plate map.
Figure 86. Plate spreadsheet in Quantitation Data tab.
The Plate spreadsheet includes the type of information shown in Table 27, including the
selected fluorophore in the plate map.
Target Amplification target name (gene)
Sample Sample description
Threshold Cycle (C(t)) Threshold cycle
C(t) Mean Mean of the threshold cycle for the replicate group
C(t) Std. Dev Standard deviation of the threshold cycle for the replicate
group
Starting Quantity (SQ) Estimate of the starting quantity of the target
Log Starting Quantity Log of the starting quantity
SQ Mean Mean of the starting quantity
SQ Std. Dev Standard deviation of the starting quantity
Set Point Temperature of sample in the well for a gradient step
Sample Note One round of denaturation, annealing, and extension, or one
round of annealing and extension steps in a protocol
Table 27. Plate spreadsheet contents
Information Description
Content Sample type and replicate number
Sample Sample description
Copy Number Starting number of targets in the sample
RFU Relative fluorescence units
Table 26. Results spreadsheet content (continued)
Information Description