HPPR/2
H172204_1_001 25 / 92
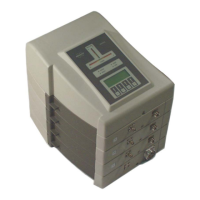
The following diagram shows the characteristics (and the pulse length dependency) of the RF
power detection.
Figure5.2: Threshold for RF Power Versus Pulse Length
The threshold value for CW pulses can be understood as the RF power of pulses of about
20s. The power limit threshold value for pulses between a few microseconds (peak power)
and the very long pulses (CW power) behaves like described above (red curve).
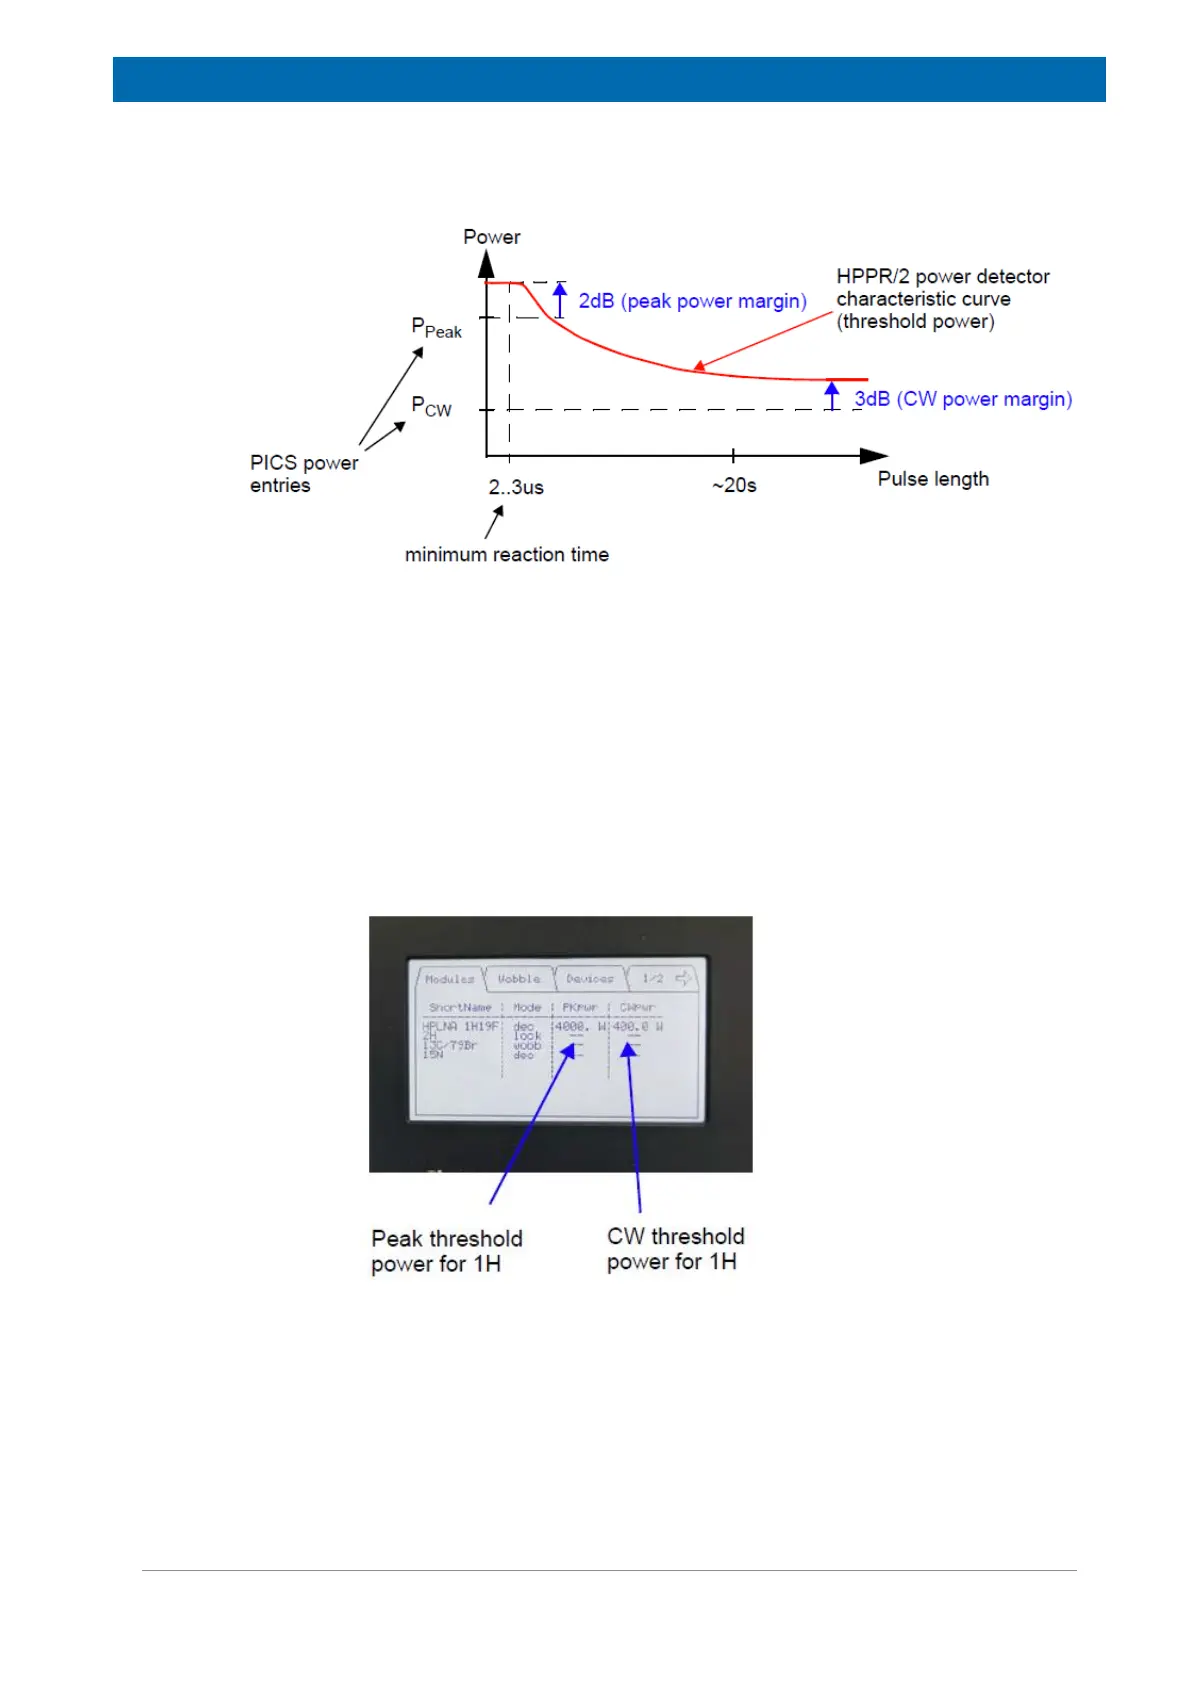
Cover2 Display
The setting of the threshold values can be monitored on the HPPR/2 COVER2 module
display (see following figures).
If no power limit detection capability is implemented for a certain HPPR/2 module, a ‘--‘ is
shown on the corresponding display line instead of the threshold power value.
Figure5.3: Cover2: Threshold Power Display
 Loading...