sequence
1 x cc_stage_time 1-2-3-4-5..x
2 x cc_stage_time 2-3-4-5..x-1
3 x cc_stage_time 3-4-5..x-1-2
4 x cc_stage_time 4-5..x-1-2-3
5 x cc_stage_time 5..x-1-2-3-5
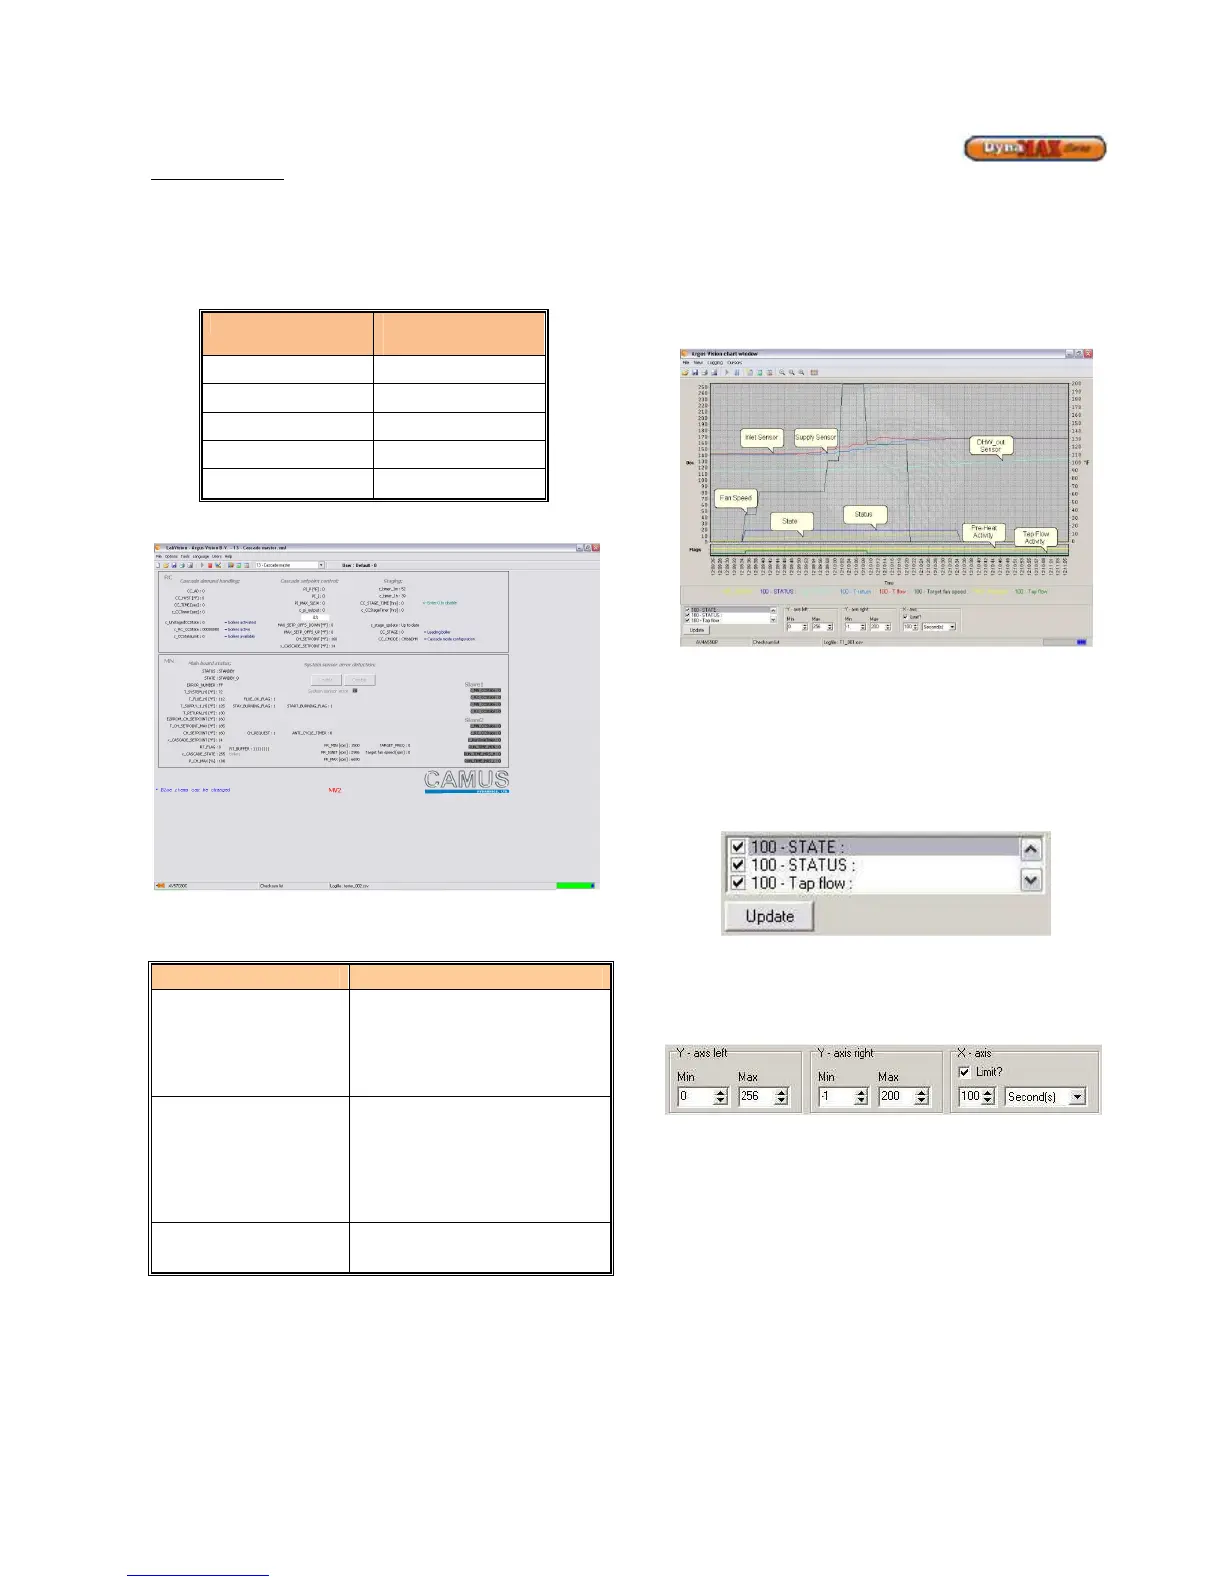
Figure 45: Cascade Screen
The following parameters can be adjusted:
Table 26: Cascade Parameters
Parameter Parameter Description
CC_HYST
This parameter is entered to
provide a modulation rate above
and below the set point. This
value must be smaller than the
CH_Hysterese.(Default: 5
o
F)
CC_TIME
This parameter is entered to
implement a delay time between
the startup of one boiler to the
next. This timer starts when a
flame signal is detected from the
first boiler.(Default: 120 sec)
CC_STAGE_TIME
Period after which boiler start-up
order changes (Defualt: 100 hrs)
Refer to section 12.14 Cascade Setup to install a Cascade
system setup.
8.8 DATA LOGGING
LabVision software also comes equipped with data logging
capability which has the ability to track return/supply, DHW
temperatures, actual and target fan speed, state and status
in a graph as the boiler is operating. This is a beneficial
feature as it improves the ability to troubleshoot and
diagnose issues in the field.
Figure 46: Data Logging Screen
To select the parameters that need to be viewed or
recorded, a Parameter Selection Box on the bottom left-side
of the screen contains all the parameters that LabVision can
track. To view or record the parameter that is required, click
the check box beside each parameter. When finished
selecting the parameters required, click on Update and this
will refresh the logging screen.
Figure 47: Parameter Selection Box
To adjust the viewing area, this can be done by adjusting the
margins for the left y-axis, right y-axis and the timeframe with
which to view.
Figure 48: Adjust Viewing Area
To record the data that is shown on screen, go to the
Toolbar and click on Logging > Start Logging. A window will
pop up on screen asking for a file name for the log file to be
captured. DO NOT change the file type, as LabVision must
record the log file as .Csv. As soon as file name is confirmed
by clicking on ‘Open’, LabVision begins capturing the data
immediately.
Also notice that the status bar has changed from blue to red.
This demonstrates that LabVision is recording to the log file
specified. The amount of data collected can be limited to a
certain size inside LabVision. When a maximum memory
limit is set, this results in over-writing previously written data
in the same log. Therefore it captures the most recent
amount of data. To prevent this from occurring this feature
can be turned off by clicking on Options > Options > Logging
tab and uncheck the parameter ‘Limit Logfile’. With this