180
uu
uu
uTo plot points in the RUN or PRGM Mode
The following is the syntax for plotting points in these modes.
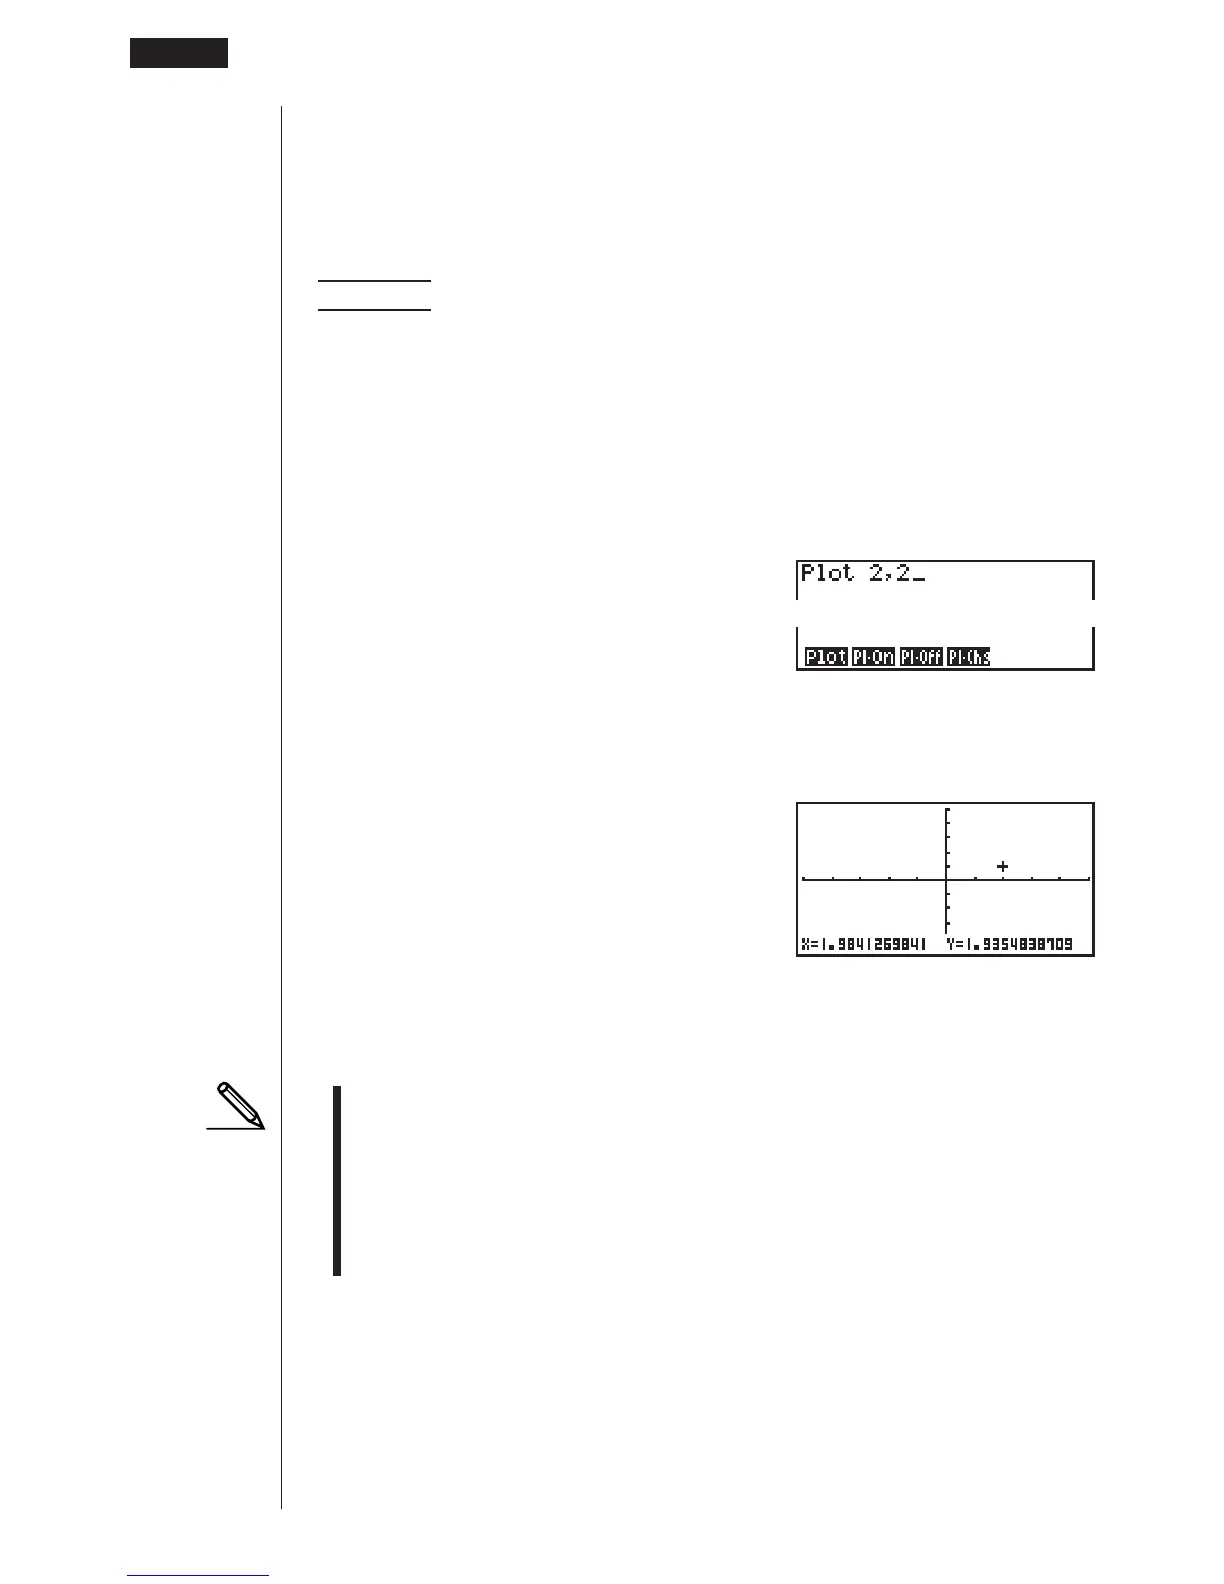
Plot <
x-coordinate>, <y-coordinate>
Example To plot a point at (2, 2)
Use the following View Window parameters.
Xmin = –5 Ymin = –10
Xmax = 5 Ymax = 10
Xscale = 1 Yscale = 2
1. After entering the RUN Mode, display the sketch menu and perform the following
operation.
!4(Sketch)6(g)
1(PLOT)1(Plot)c,c
2. Press w and the pointer appears on the display. Press w again to plot a point.
ww
• You can use the cursor keys (f, c, d, e) to move the pointer around the
screen.
• If you do not specify coordinates, the pointer is located in the center of the
graph screen when it appears on the display.
• If the coordinates you specify are outside the range of the View Window param-
eters, the pointer will not be on the graph screen when it appears on the dis-
play.
• The current
x- and y-coordinate values are assigned respectively to variables X
and Y.
10 - 2 Graphing with the Sketch Function
1 23456