307
Next, you can use the following.
1 (X) ............ Linear regression
2 (Med) ....... Med-Med regression
3 (X^2) ........ Quadratic regression
4 (X^3) ........ Cubic regression
5 (X^4) ........ Quartic regression
6 (g) ........... Next menu
1 (Log) ........ Logarithmic regression
2 (Exp) ........ Exponential regression
3 (Pwr) ........ Power regression
6 (g) ........... Previous menu
The meanings of the parameters that appear on this screen are the same as those
for “Linear Regression Graph” to “Power Regression Graph”.
kk
kk
k Estimated Value Calculation ( , )
After drawing a regression graph with the STAT Mode, you can use the RUN Mode
to calculate estimated values for the regression graph's x and y parameters.
• Note that you cannot obtain estimated values for a Med-Med, quadratic regres-
sion, cubic regression, or quartic regression graph.
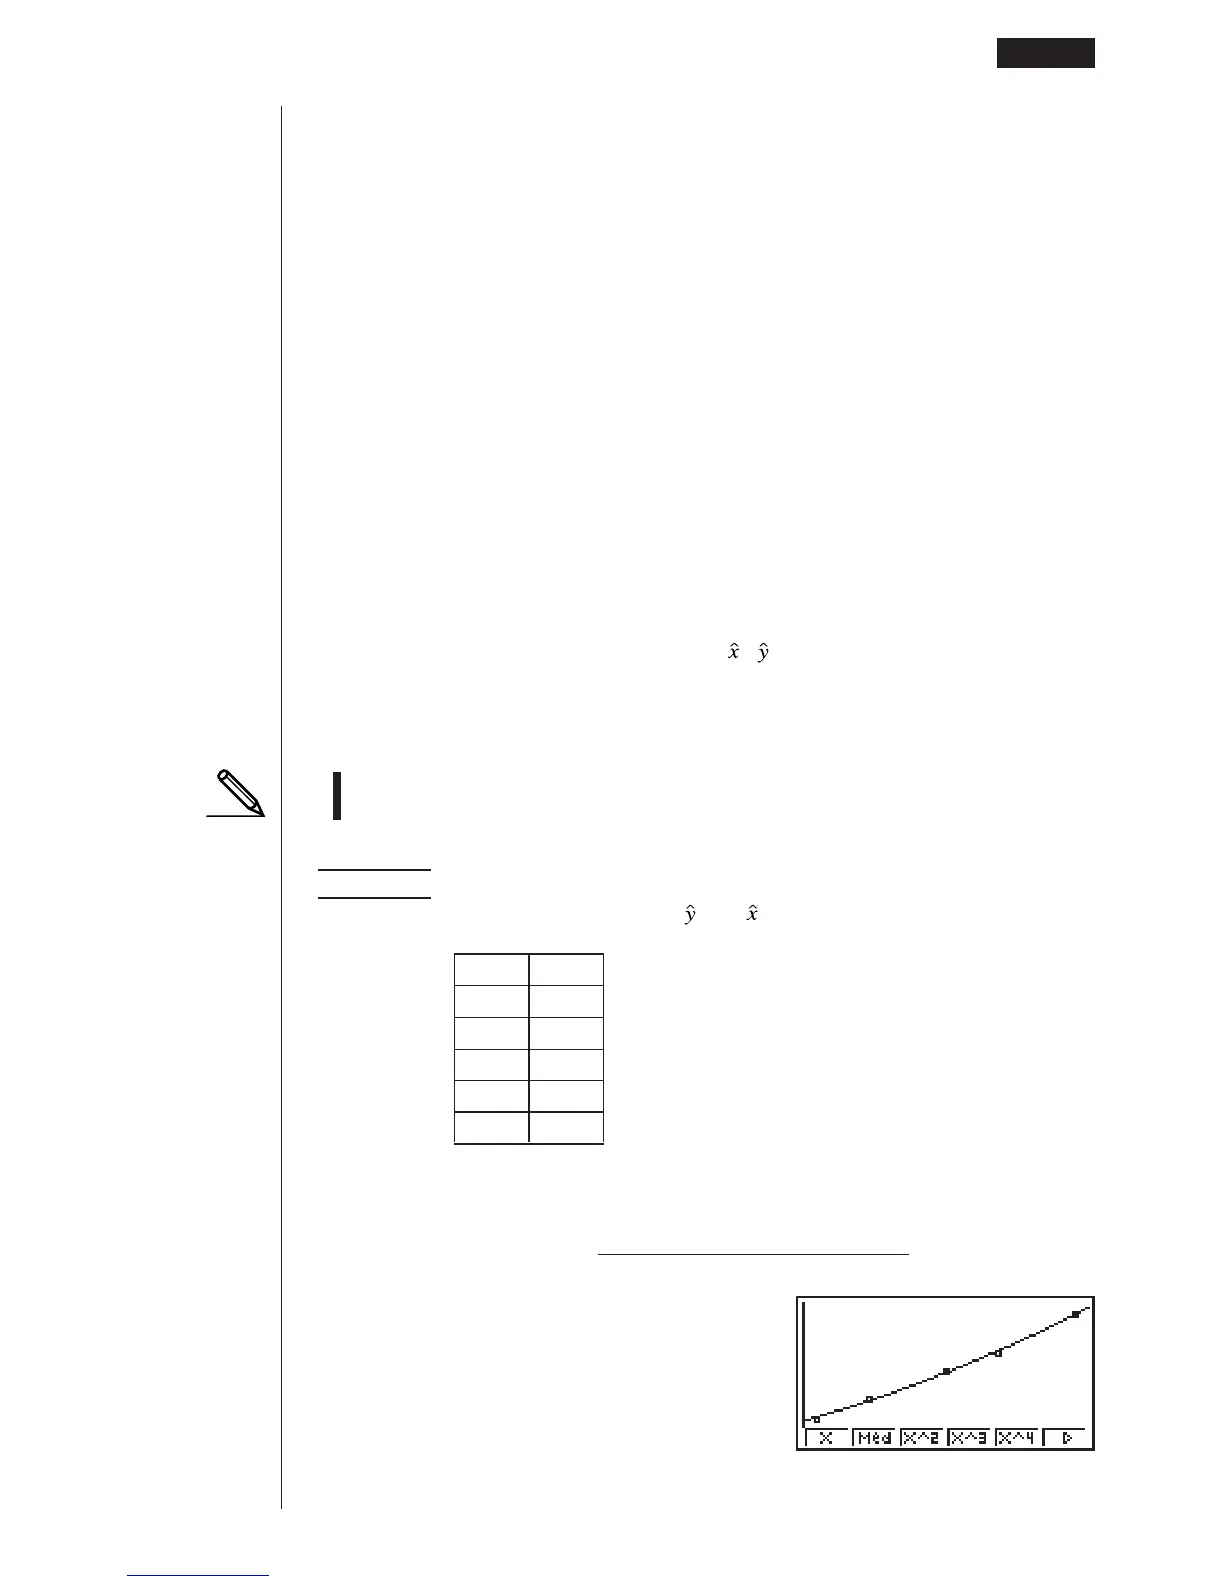
Example To perform power regression using the following data and
estimate the values of and when xi = 40 and yi = 1000
xi yi
28 2410
30 3033
33 3895
35 4491
38 5717
1. In the Main Menu, select the STAT icon and enter the STAT Mode.
2. Input data into the list and
draw the power regression graph*.
3. In the Main Menu, select the RUN icon and enter the RUN Mode.
Performing Statistical Calculations 18 - 6