300
6(DRAW)
The following are the meanings of the above parameters.
a ...... Regression coefficient
b ...... Regression constant term
r ...... Correlation coefficient
kk
kk
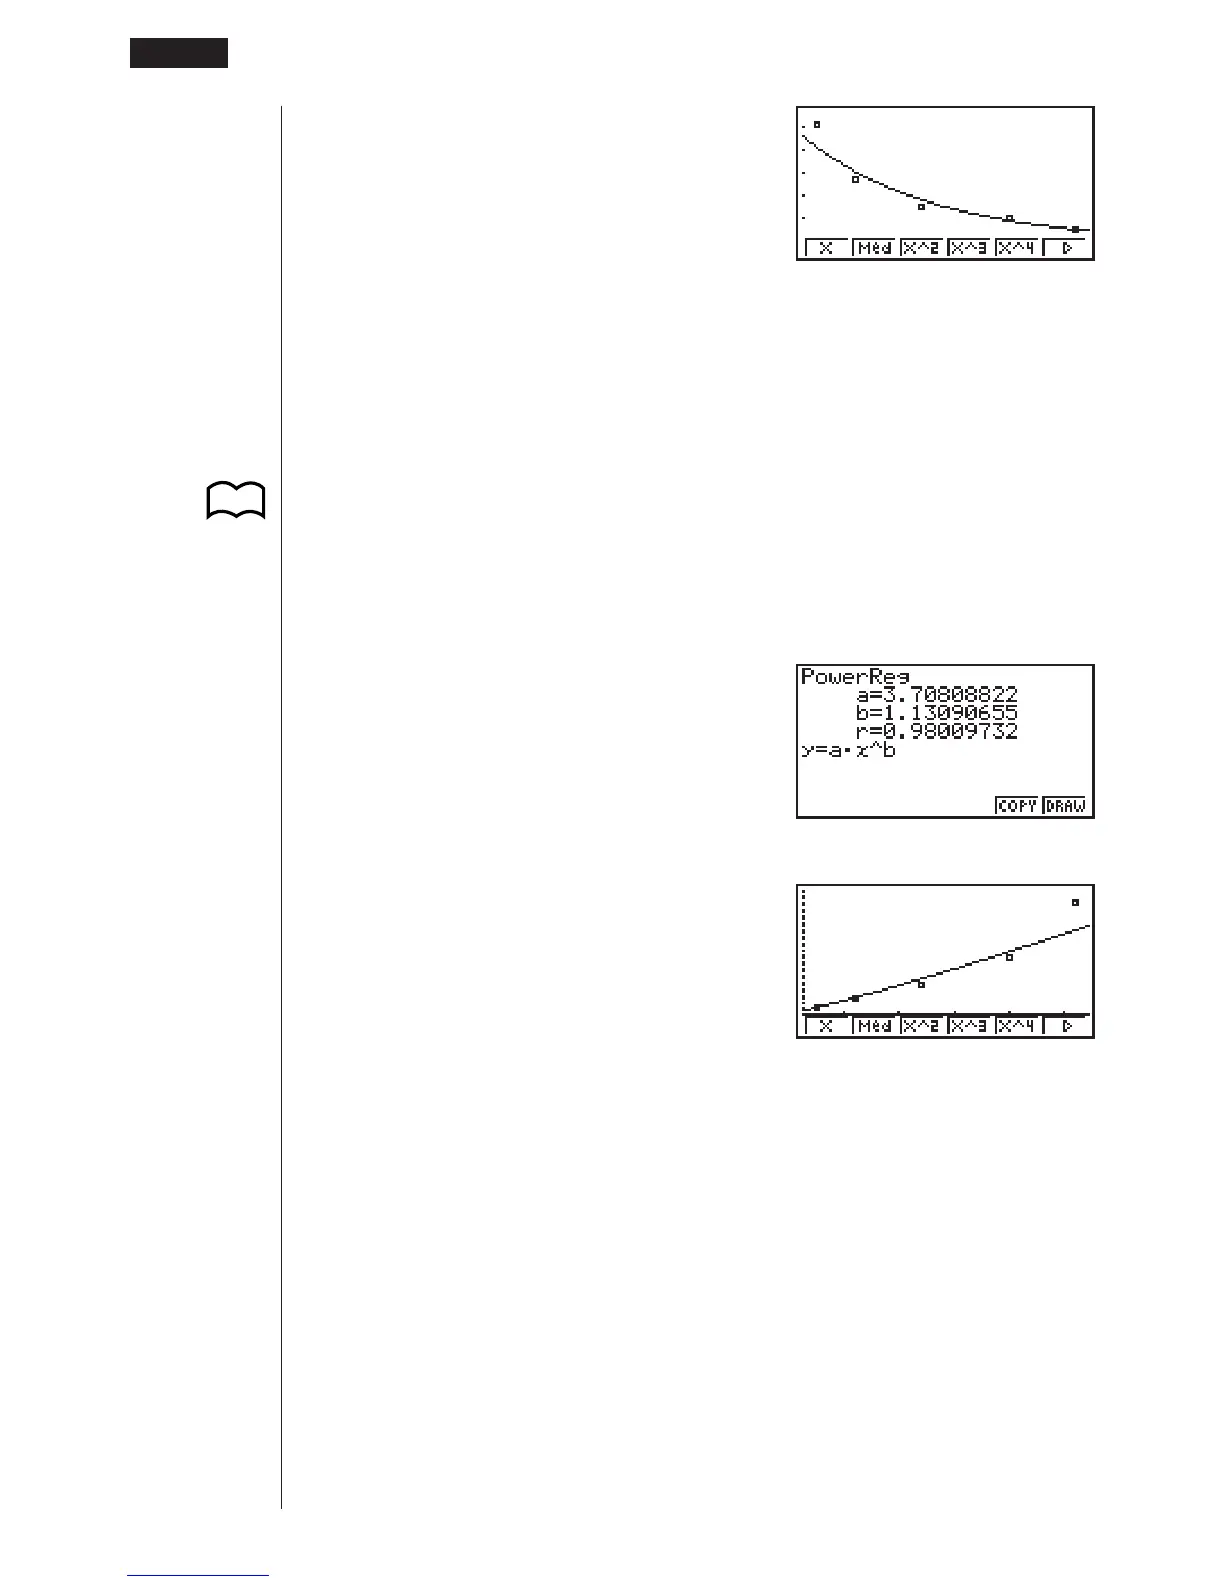
k Power Regression Graph
Exponential regression expresses y as a proportion of the power of x. The standard
power regression formula is y = a % x
b
, so if we take the logarithms of both sides we
get logy = loga + b % logx. Next, if we say X = log x, Y = logy, and a = loga, the
formula corresponds to linear regression formula Y = a + bX.
6(g)3(Pwr)
6(DRAW)
The following are the meanings of the above parameters.
a ...... Regression coefficient
b ...... Regression power
r ...... Correlation coefficient
123456
18 - 4 Calculating and Graphing Paired-Variable Statistical Data
P.290