179
uu
uu
uTo graph an inverse function in the RUN or PRGM Mode
The following is the syntax for graphing an inverse function in these modes.
Inverse <graph function>
• Use the variable data (VARS) menu to specify the function to be graphed.
• You can only graph the inverse of functions whose graph type is specified as
rectangular coordinate type.
kk
kk
k Plotting Points
When plotting points on a graph, first display the sketch menu and then press 6
(g) 1 (PLOT) to display the plot menu.
6(g)1(PLOT)
1 (Plot) ........ Plot a point
2 (Pl•On) ..... Plot point at specific coordinates
3 (Pl•Off) ..... Delete point at specific coordinates
4 (Pl•Chg) ... Switch status of point at specific coordinates
uu
uu
uTo plot points in the STAT, GRAPH, TABLE, RECUR and CONICS
Modes
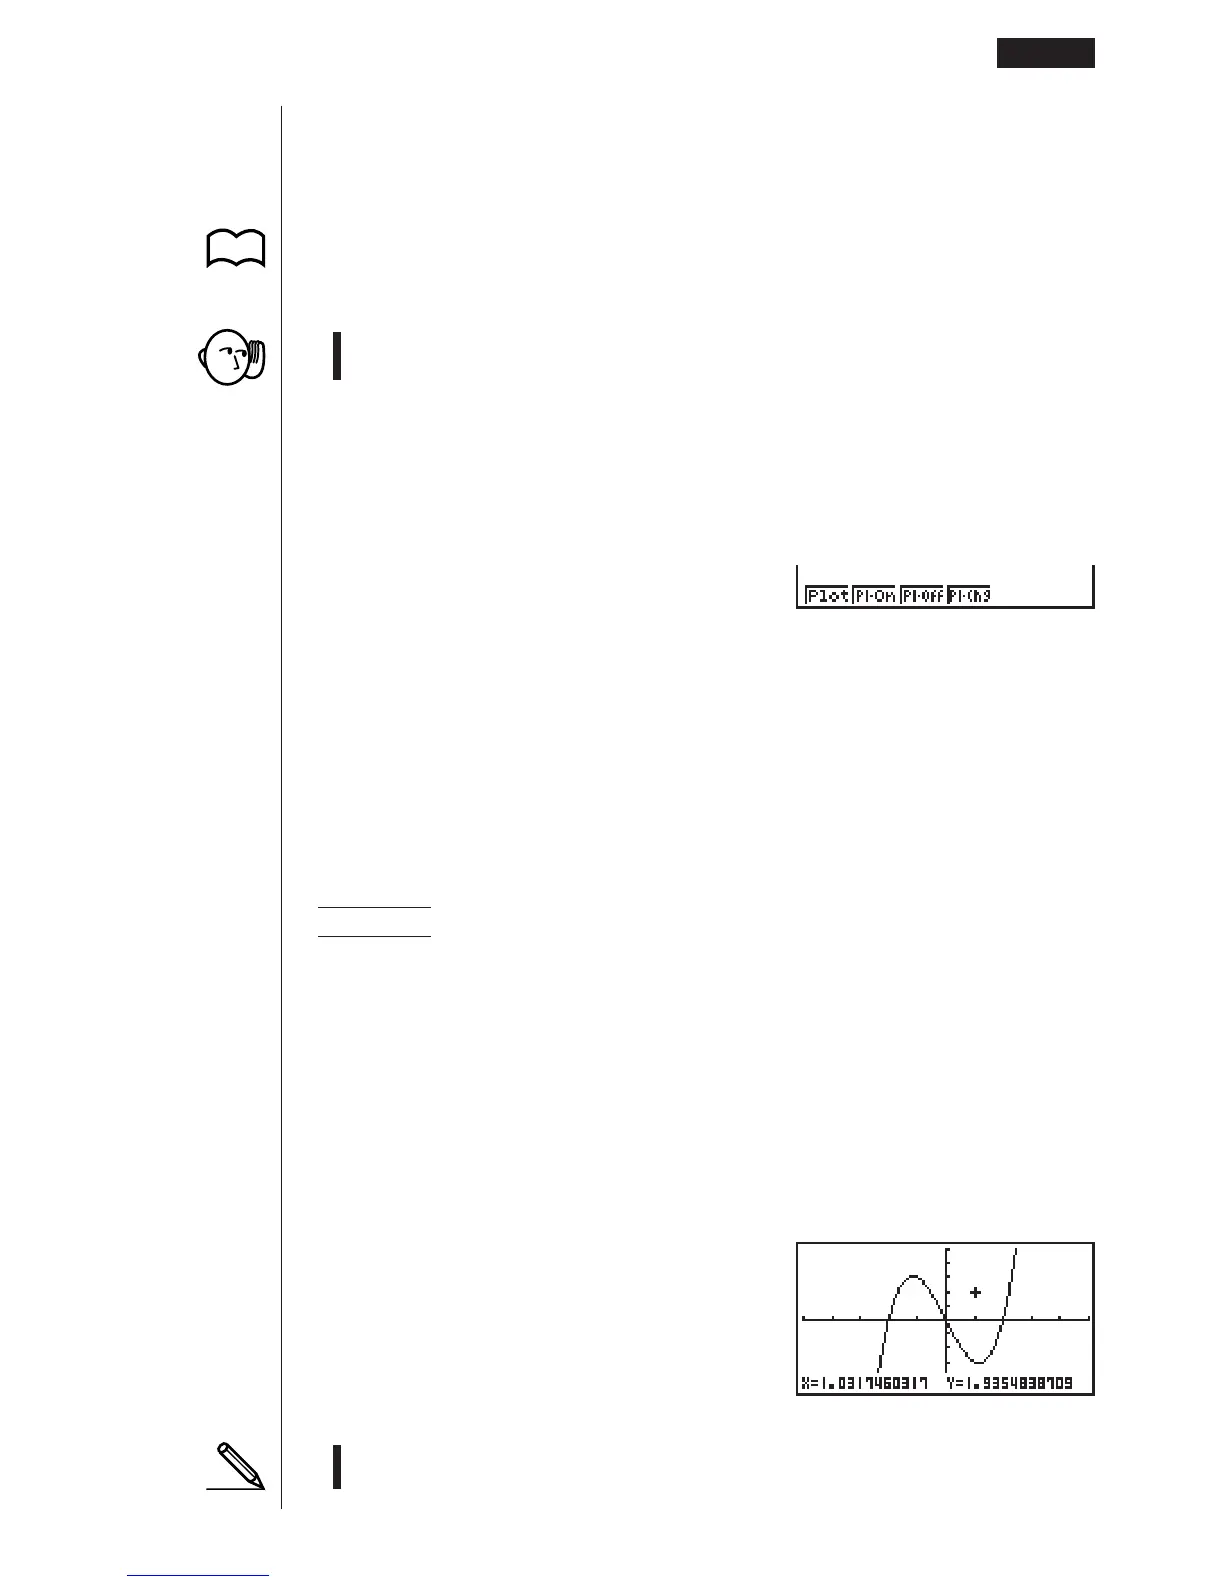
Example To plot a point on the graph of y = x(x + 2)(x – 2)
1. After graphing the function, display the sketch menu and perform the following
operation to cause the pointer to appear on the graph screen.
!4(Sketch)6(g)1(PLOT)1(Plot)
2. Use the cursor keys (f, c, d, e) to move the pointer the locations of the
points you want to plot and press w to plot.
• You can plot as many points as you want.
e ~ ef ~ f
w
• The current x - and y-coordinate values are assigned respectively to variables X
and Y.
Graphing with the Sketch Function 10 - 2
123456
P.33