304
18-5 Other Graphing Functions
kk
kk
k Manual Graphing
In all of the graphing examples up to this point, values were calculated in accord-
ance with View Window settings and graphing was performed automatically. This
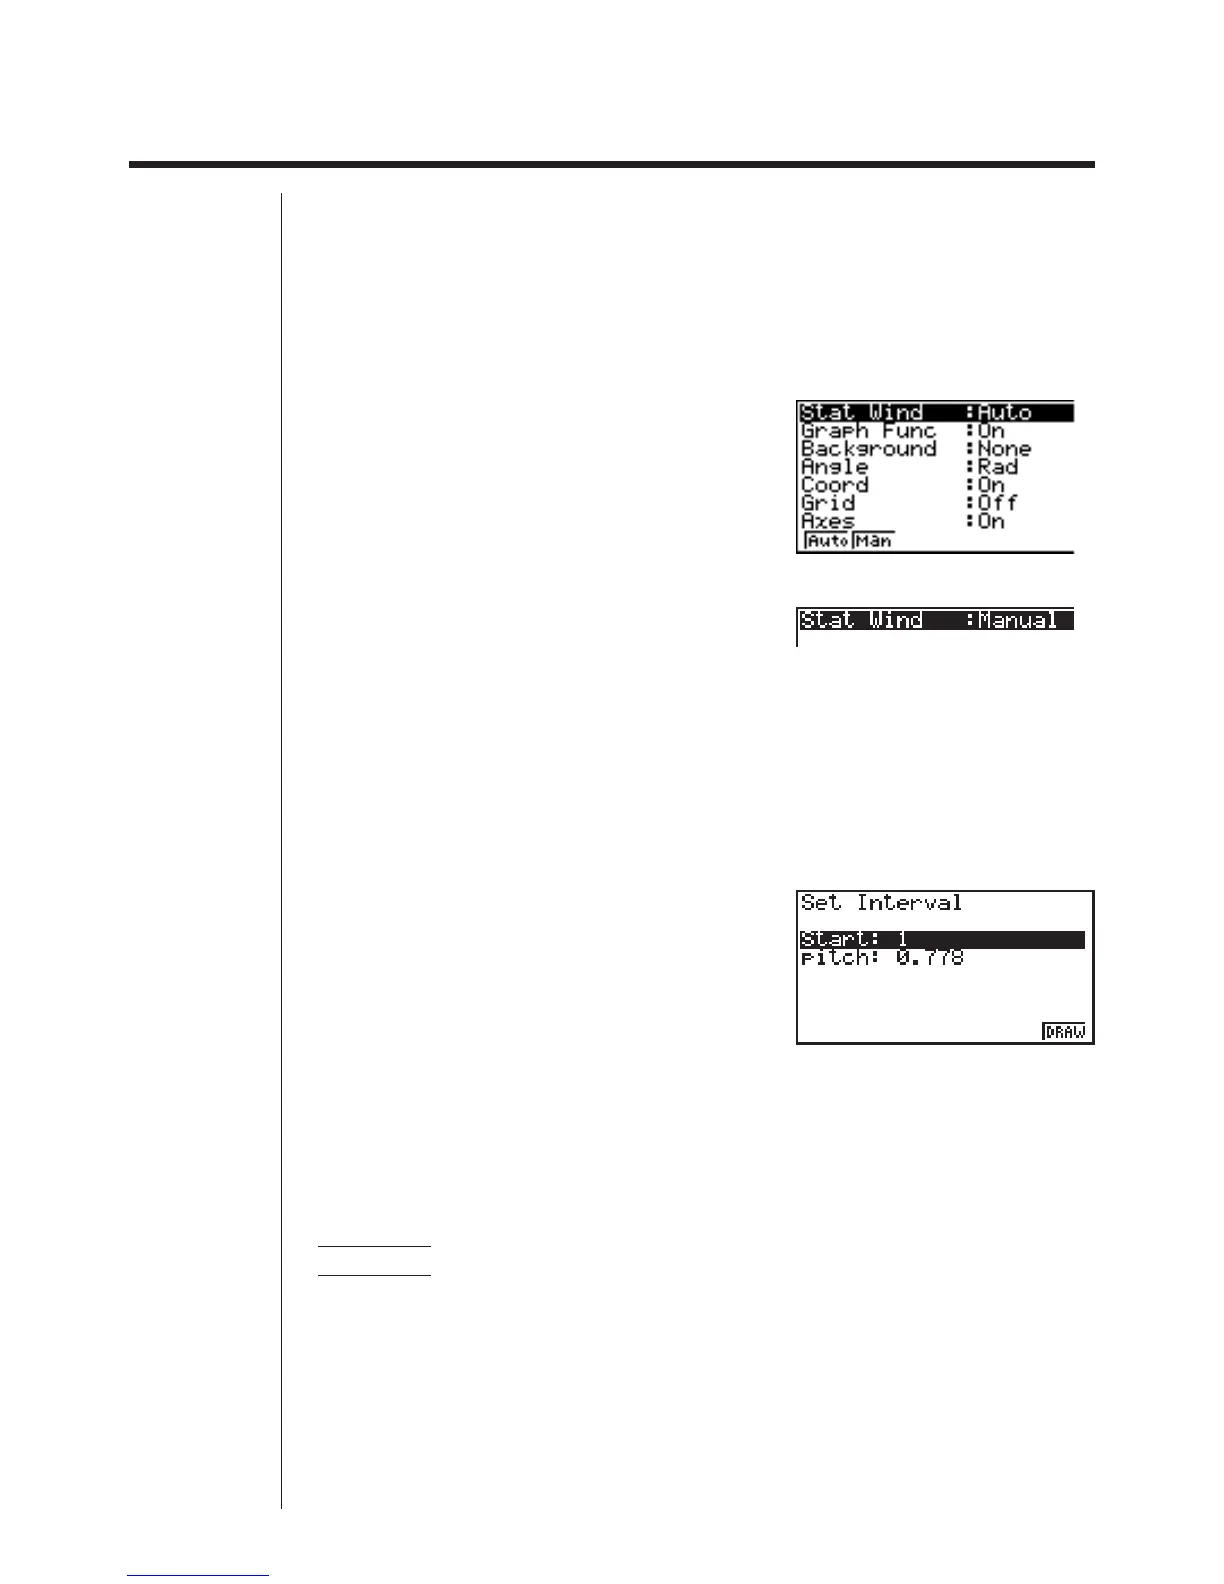
automatic graphing is performed when the Stat Wind item of the View Window is set
to “Auto” (auto graphing). You can also produce graphs manually, when the auto-
matic graphing capabilities of this calculator cannot produce the results you want.
!Z
2(Man)
Performing this setting does not change View Window values, and the
graph is drawn using the values currently set in the View Window.
kk
kk
k Setting the Width of a Histogram/Line Graph
Selecting histogram or line graph as the graph type causes the following screen to
appear before the graph is drawn.
The following are the meanings of the items that appear in this screen.
Start ................ Histogram/line graph start point (x-coordinate)
pitch ................ Bar spacing, or point spacing (specify as scale unit)
• When “Auto” is specified for the statistical graph window setting (Stat Wind), the
calculator automatically calculates standard values for Start and pitch.
Example Start: 0, pitch: 10
While the statistical data list is on the display, perform the following procedure.
!Z2(Man)
J(Returns to previous menu.)
1(GRPH)1(GPH1)
aw(Start value is
x = 0.)
baw(pitch = 10)
1 2 3456