302
kk
kk
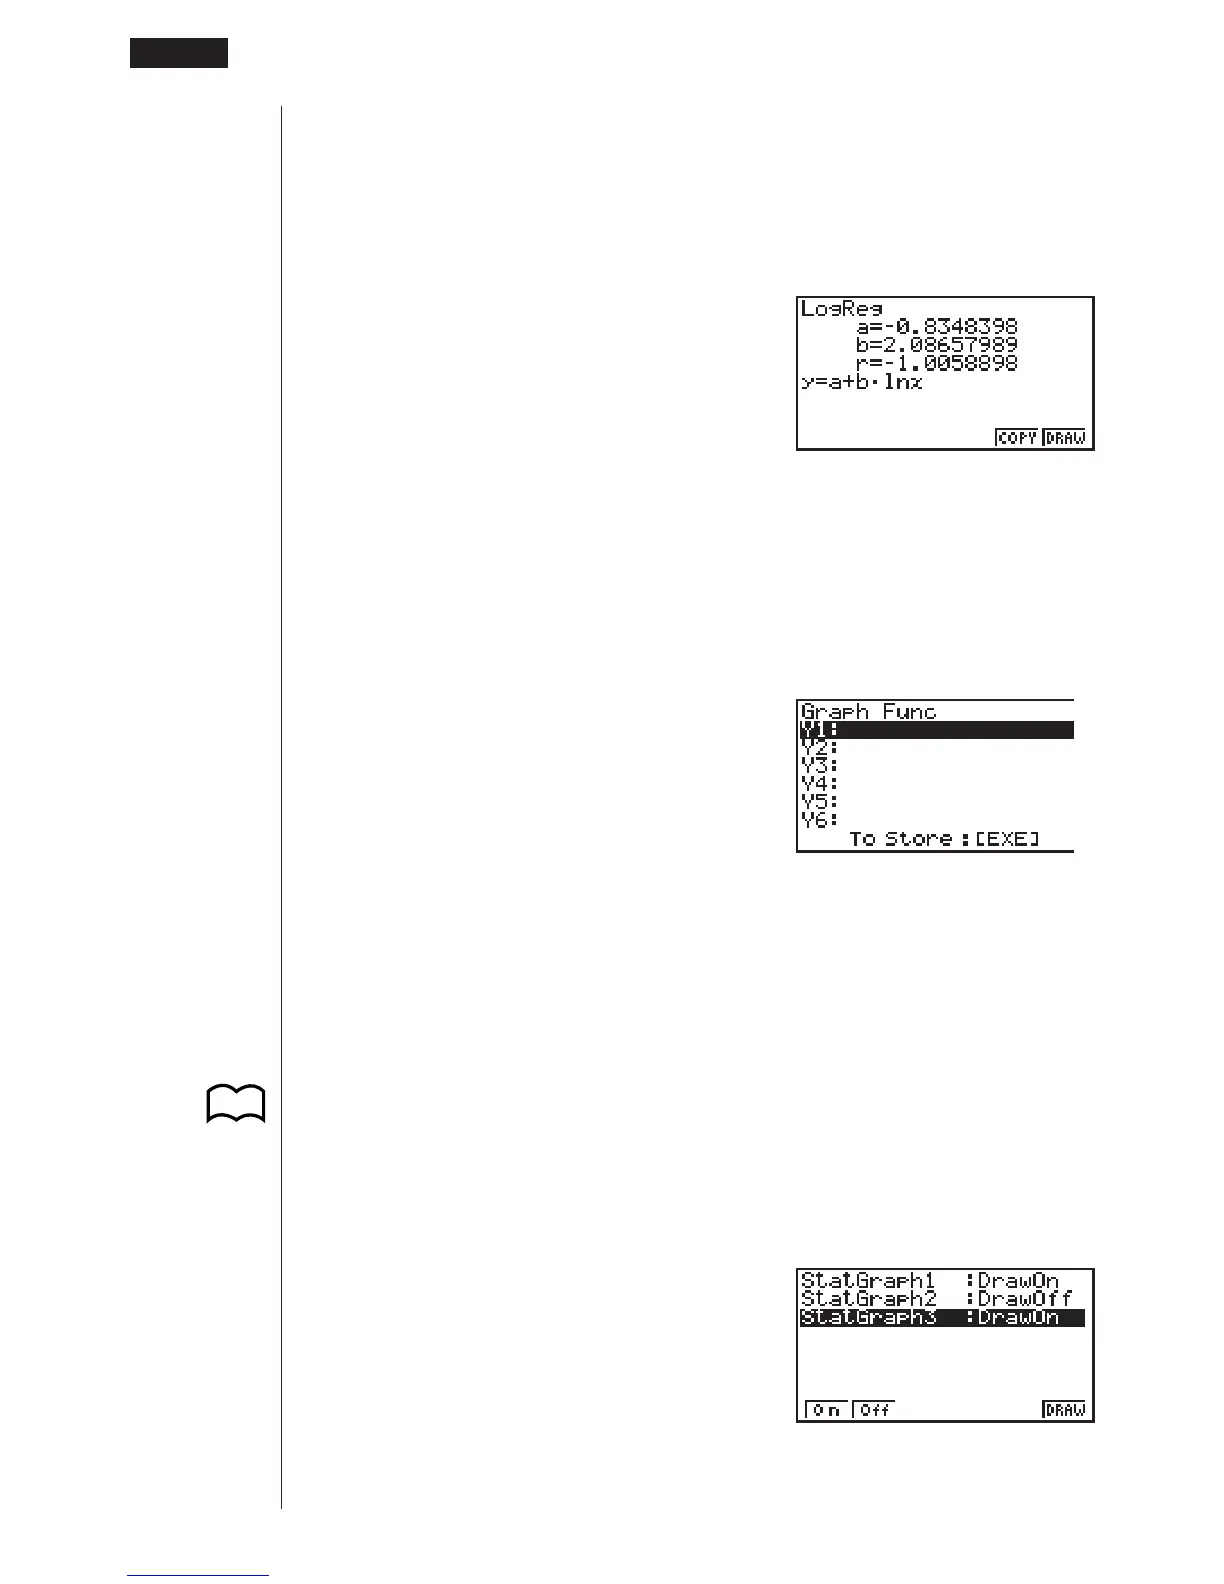
k Copying a Regression Graph Formula to the Graph Mode
After you perform a regression calculation, you can copy its formula to the GRAPH
Mode.
The following are the functions that are available in the function menu at the bottom
of the display while regression calculation results are on the screen.
5 (COPY) .... Stores the displayed regression formula to the GRAPH Mode
6 (DRAW).... Graphs the displayed regression formula
1. Press 5 (COPY) to copy the regression formula that produced the displayed
data to the GRAPH Mode.
5(COPY)
Note that you cannot edit regression formulas for graph formulas in the GRAPH
Mode.
2. Press w to save the copied graph formula and return to the previous regression
calculation result display.
kk
kk
k Multiple Graphs
You can draw more than one graph on the same display by using the procedure
under “Changing Graph Parameters” to set the graph draw (On)/non-draw (Off) sta-
tus of two or all three of the graphs to draw (On), and then pressing 6 (DRAW).
After drawing the graphs, you can select which graph formula to use when perform-
ing single-variable statistic or regression calculations.
123456
P.286
123456
18 - 4 Calculating and Graphing Paired-Variable Statistical Data