140
8-5 Drawing Graphs Manually
After you select the RUN icon in the Main Menu and enter the RUN Mode, you can
draw graphs manually. First press ! 4 (Sketch) 5 (GRPH) to recall the Graph
Command Menu, and then input the graph function.
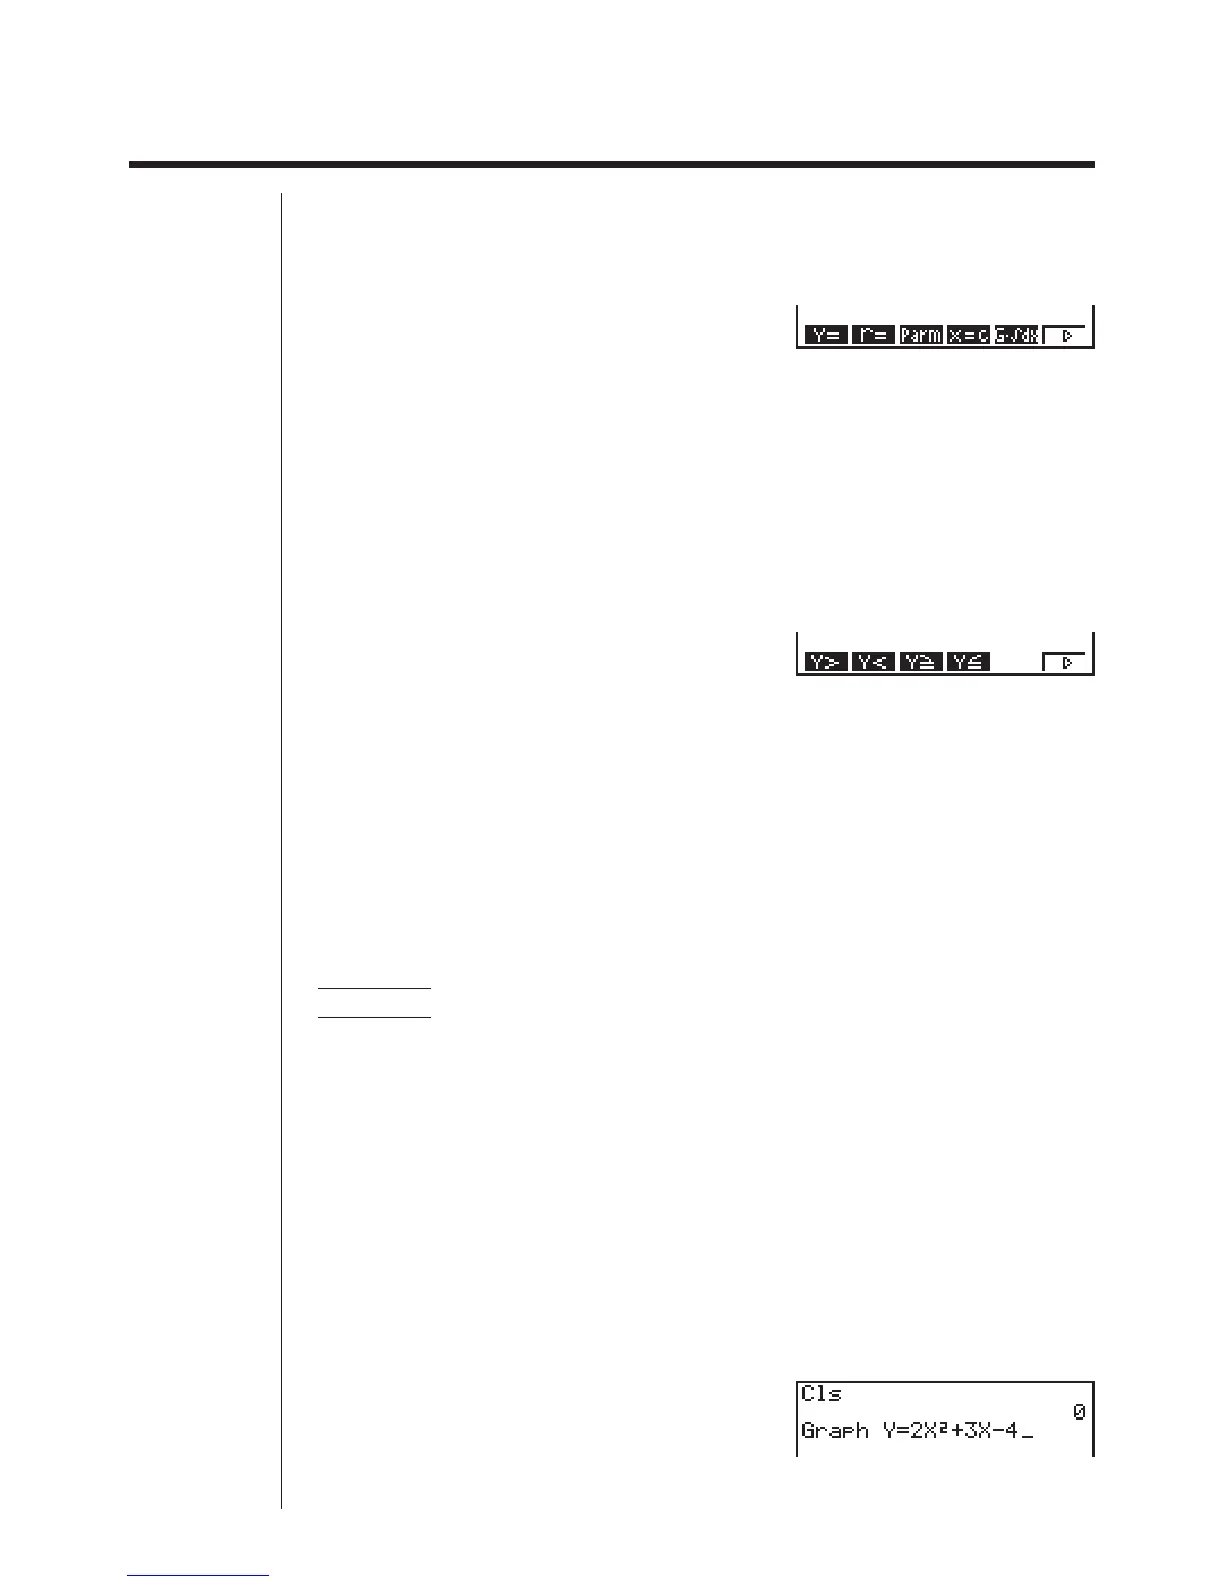
!4(Sketch)
5(GRPH)
1 (Y =) ......... Rectangular coordinate graph
2 (r =) .......... Polar coordinate graph
3 (Parm) ...... Parametric graph
4 (X = c) ...... X = constant graph
5 (G'
dx) ....... For drawing integration graphs
6 (g) ........... Next menu
6(g)
1 (Y >) ......... Y > f
(x) inequality
2 (Y <) ......... Y < f
(x) inequality
3 (Y $) ......... Y >
f
(x) inequality
4 (Y %) ......... Y < f
(x) inequality
6 (g) ........... Previous menu
uu
uu
uTo graph using rectangular coordinates (Y =)
You can graph functions that can be expressed in the format y = f(x).
Example To graph y = 2x
2
+ 3x – 4
Use the following View Window parameters.
Xmin = –5 Ymin = –10
Xmax = 5 Ymax = 10
Xscale = 2 Yscale = 5
1. In the set-up screen, specify the appropriate graph type for Func Type.
!Zc1(Y =)J
2. Input the rectangular coordinate (Y =) expression.
!4(Sketch)1(Cls)w
5(GRPH)1(Y =)
cvx+dv-e
12345 6
123456