285
18-2 Paired-Variable Statistical Calculation
Examples
Once you input data, you can use it to produce a graph and check for tendencies.
You can also use a variety of different regression calculations to analyze the data.
Example To input the following two data groups and perform statistical
calculations
0.5, 1.2, 2.4, 4.0, 5.2
–2.1, 0.3, 1.5, 2.0, 2.4
kk
kk
k Inputting Data into Lists
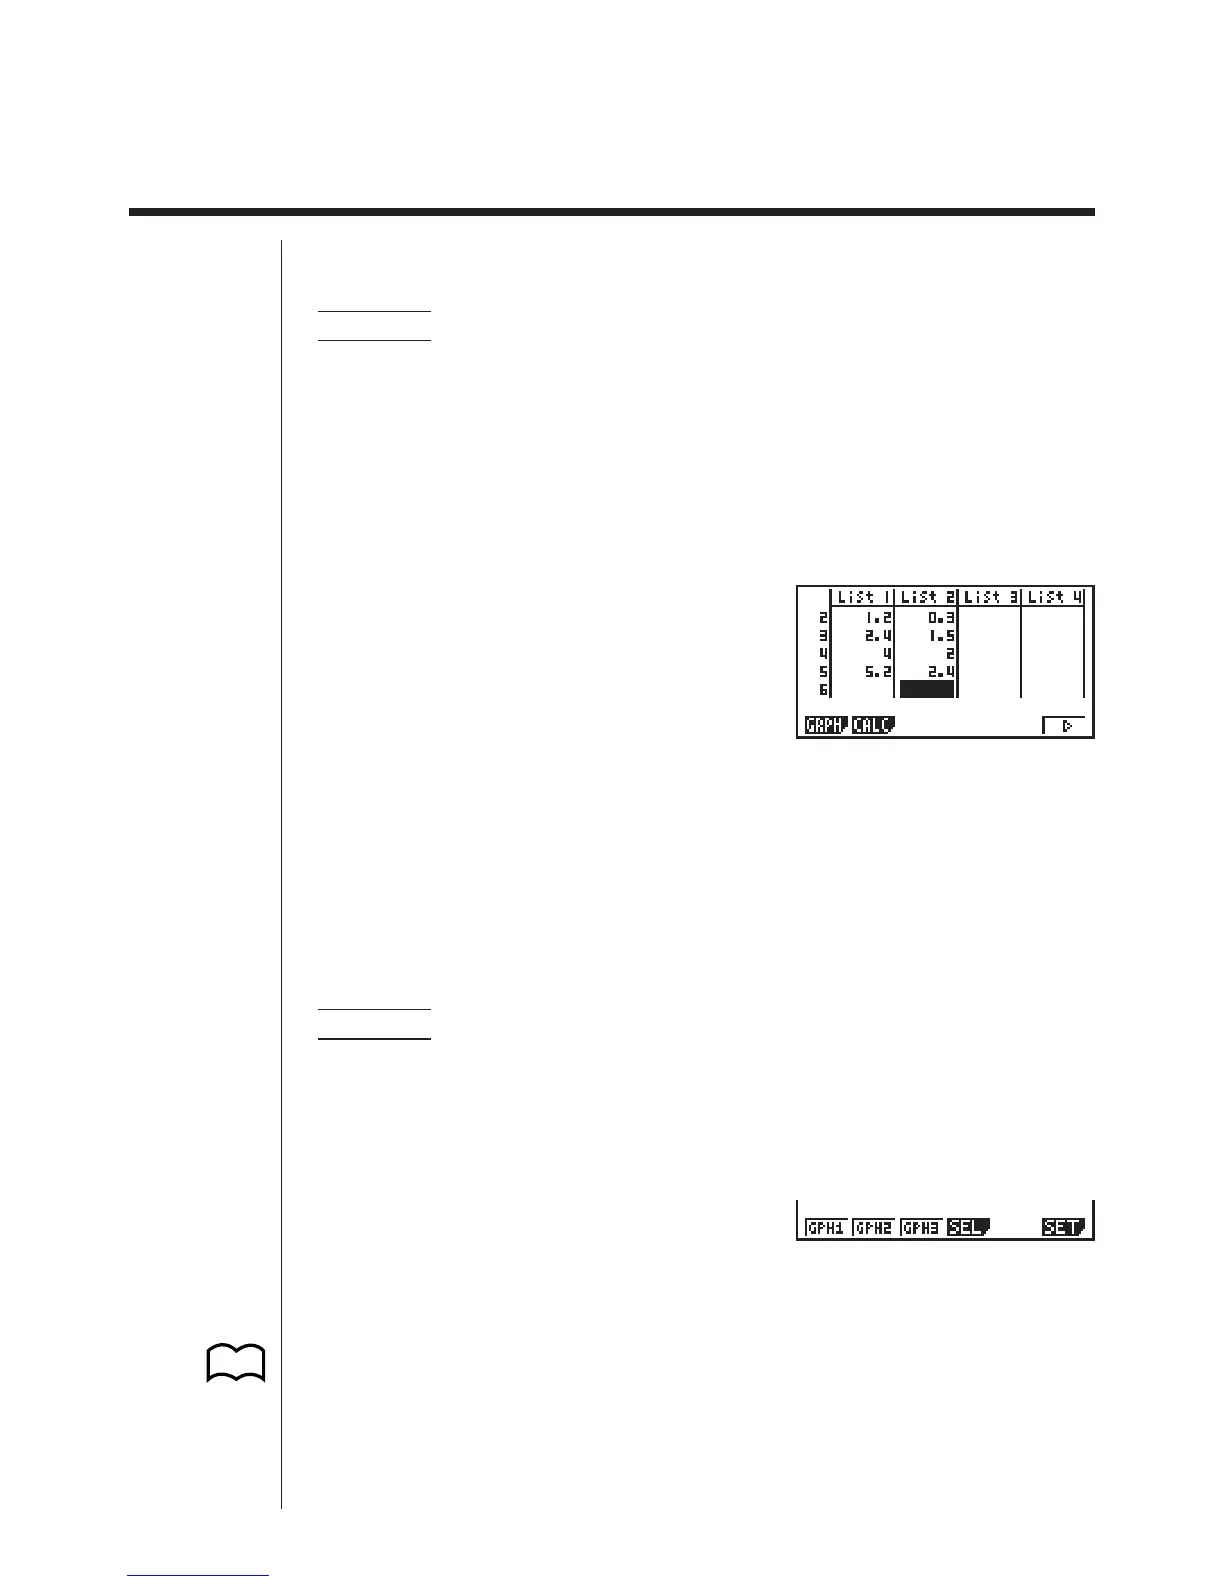
Input the two groups of data into List 1 and List 2.
a.fwb.cw
c.ewewf.cw
e
-c.bwa.dw
b.fwcwc.ew
Once data is input, you can use it for graphing and statistical calculations.
• Input values can be up to 10 digits long.
• You can use the f, c, d and e keys to move the highlighting to any cell in
the lists for data input.
kk
kk
k Plotting Data
Example To specify Graph 1 as non-draw (Off) and Graph 3 as draw (On)
and use Graph 3 to plot the data you input into statistical data
List 1 and List 2 above
While the statistical data list is on the display, press 1 (GRPH) to display the graph
menu.
1(GRPH)
1 (GPH1) ..... Graph 1 draw
2 (GPH2) ..... Graph 2 draw
3 (GPH3) ..... Graph 3 draw
4 (SEL)........ Graph (GPH1, GPH2, GPH3) selection
6 (SET) ....... Graph settings (graph type, list assignments)
12345 6
P.287
P.288