301
kk
kk
k Displaying Paired-Variable Statistical Results
Paired-variable statistics can be expressed as both graphs and parameter values.
When these graphs are displayed, the menu at the bottom of the screen appears as
below.
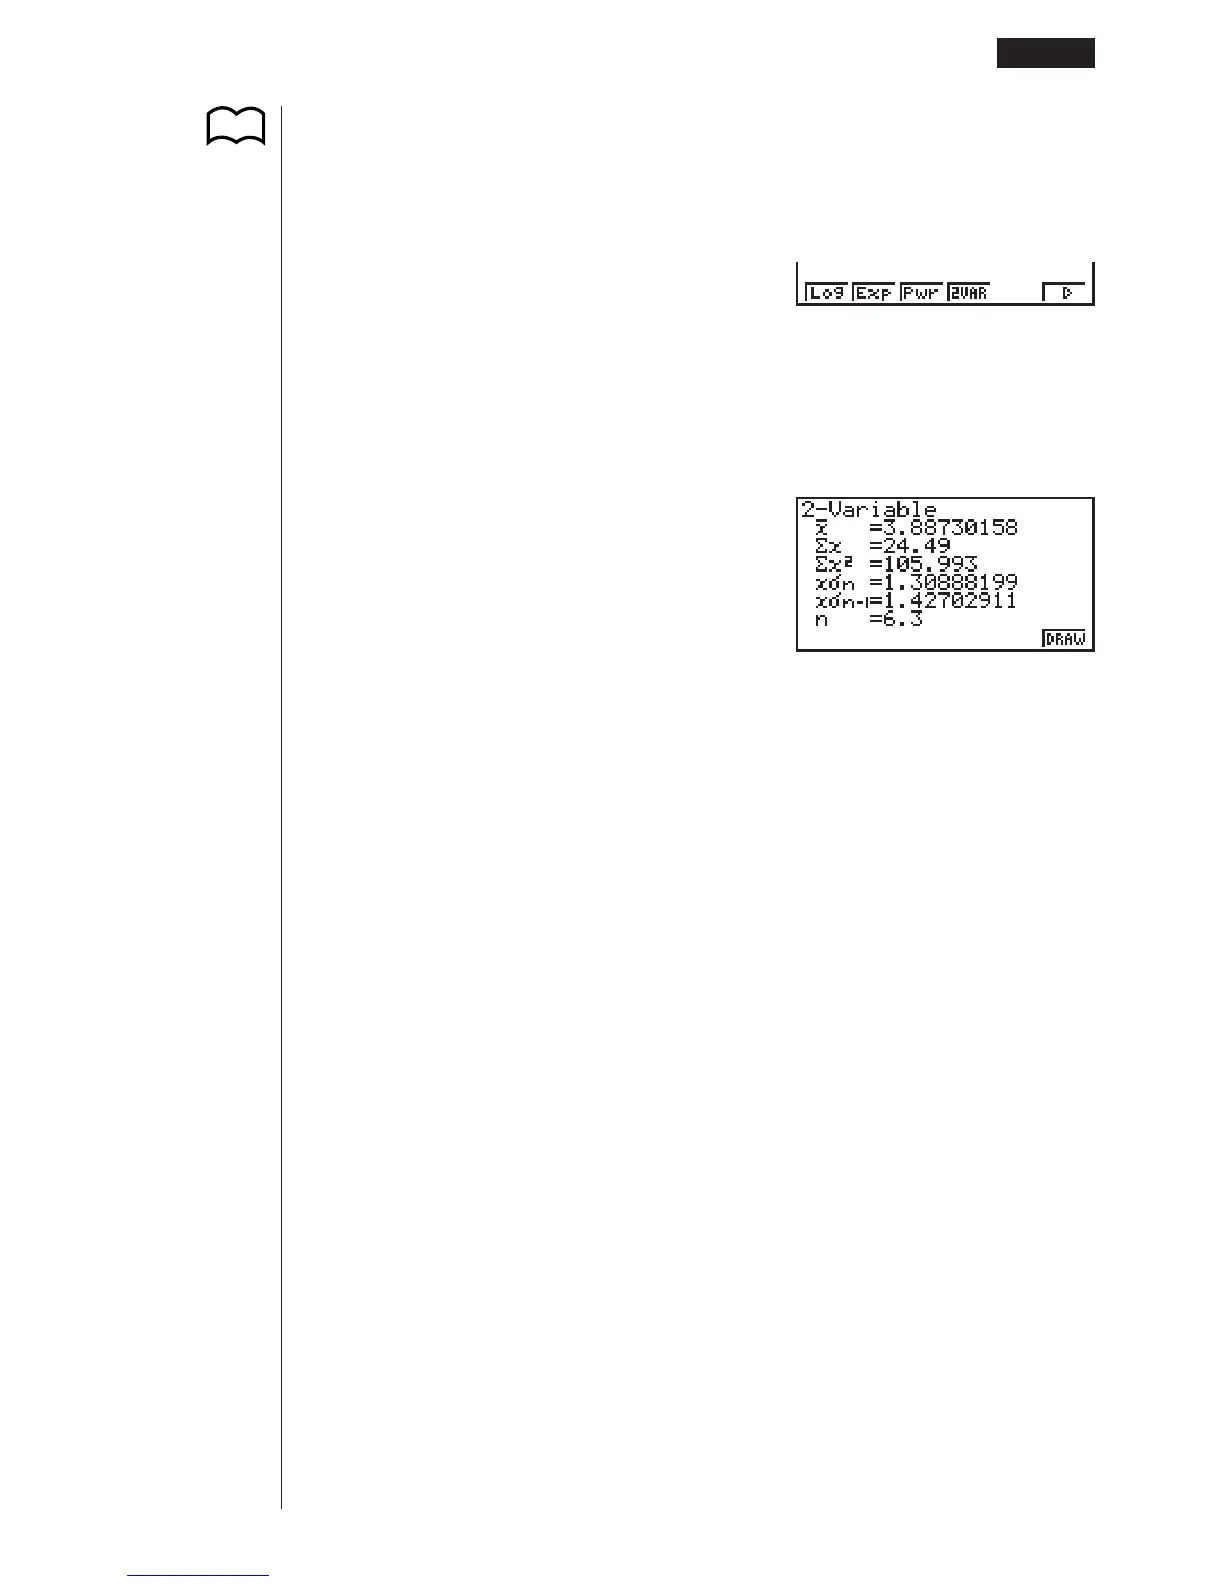
4(2VAR) ...... Paired-variable calculation result menu
Pressing 4 (2VAR) displays the following screen.
4(2VAR)
• Use c to scroll the list so you can view the items that run off the bottom of the
screen. The following describes the meaning of each of the parameters.
_
x ..................... Mean of xList data
$
x ................... Sum of xList data
$x
2
.................. Sum of squares of xList data
x#n .................. Population standard deviation of xList data
x#n-1 ................ Sample standard deviation of xList data
n ..................... Number of xList data items
_
y ..................... Mean of yList data
$y ................... Sum of yList data
$
y
2
.................. Sum of squares of yList data
y#n .................. Population standard deviation of yList data
y#n-1 ................ Sample standard deviation of yList data
$xy ..................Sum of xList and yList data
minX ............... Minimum of
xList data
maxX .............. Maximum of xList data
minY ............... Minimum of yList data
maxY .............. Maximum of
yList data
1234 56
Calculating and Graphing Paired-Variable Statistical Data 18 - 4
P.290