228
14-3 Implicit Function Graph Analysis
You can determine approximations of the following analytical results using implicit
function graphs.
• Focus/vertex calculation
• Latus rectum calculation
• Center/radius calculation
•
x-/y-intercept calculation
• Directrix/axis of symmetry drawing and analysis
• Asymptote drawing and analysis
After graphing an implicit function, press 5 (G-Solv) to display the Graph Analysis
Menu.
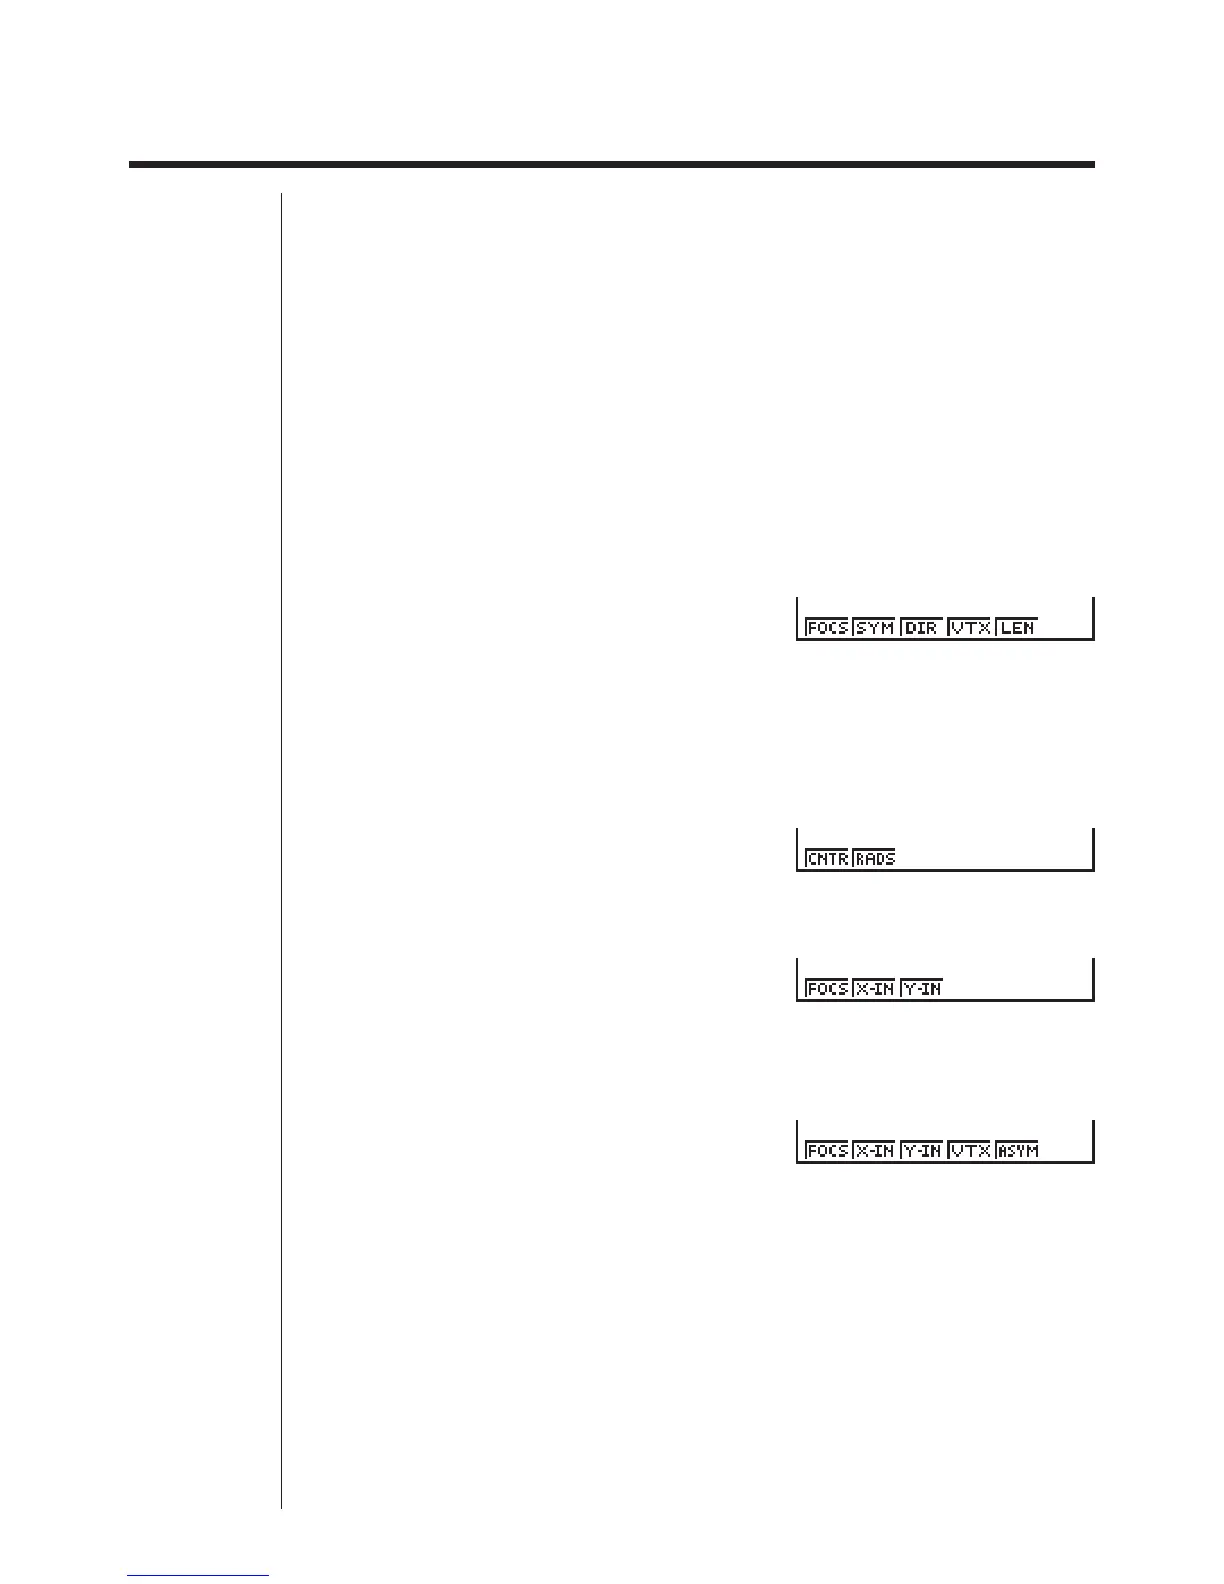
• Parabolic Graph Analysis
1 (FOCS) .... Determines the focus.
2 (SYM)....... Draws the axis of symmetry.
3 (DIR) ........ Draws the directrix.
4 (VTX) ....... Determines the vertex.
5 (LEN) ....... Determines the latus rectum.
• Circle Graph Analysis
1 (CNTR) .... Determines the center.
2 (RADS) .... Determines the radius.
• Ellipse Graph Analysis
1 (FOCS) .... Determines the focus.
2 (X-IN) ....... Determines the
x-intercept.
3 (Y-IN) ........ Determines the y-intercept.
• Hyperbolic Graph Analysis
1 (FOCS) .... Determines the focus.
2 (X-IN) ....... Determines the
x-intercept.
3 (Y-IN) ........ Determines the y-intercept.
4 (VTX) ....... Determines the vertex.
5 (ASYM) .... Determines the asymptote.
The following examples show how to use the above menus with various types of
implicit function graphs.
123456
123456
123456
123456
 Loading...


