203
12-2 Using Graph-to-Table
uu
uu
uTo store graph pointer coordinates in a table
• If the Derivative item in the set up screen is turned on, the following operation
also stores derivatives in the table.
Example To store the points of intersection and the coordinates for the
following graphs where X = 0:
Y1 = x
2
– 3
Y2 = –x + 2
Use the following View Window parameters.
Xmin = –5 Ymin = –10
Xmax = 5 Ymax = 10
Xscale = 1 Yscale = 2
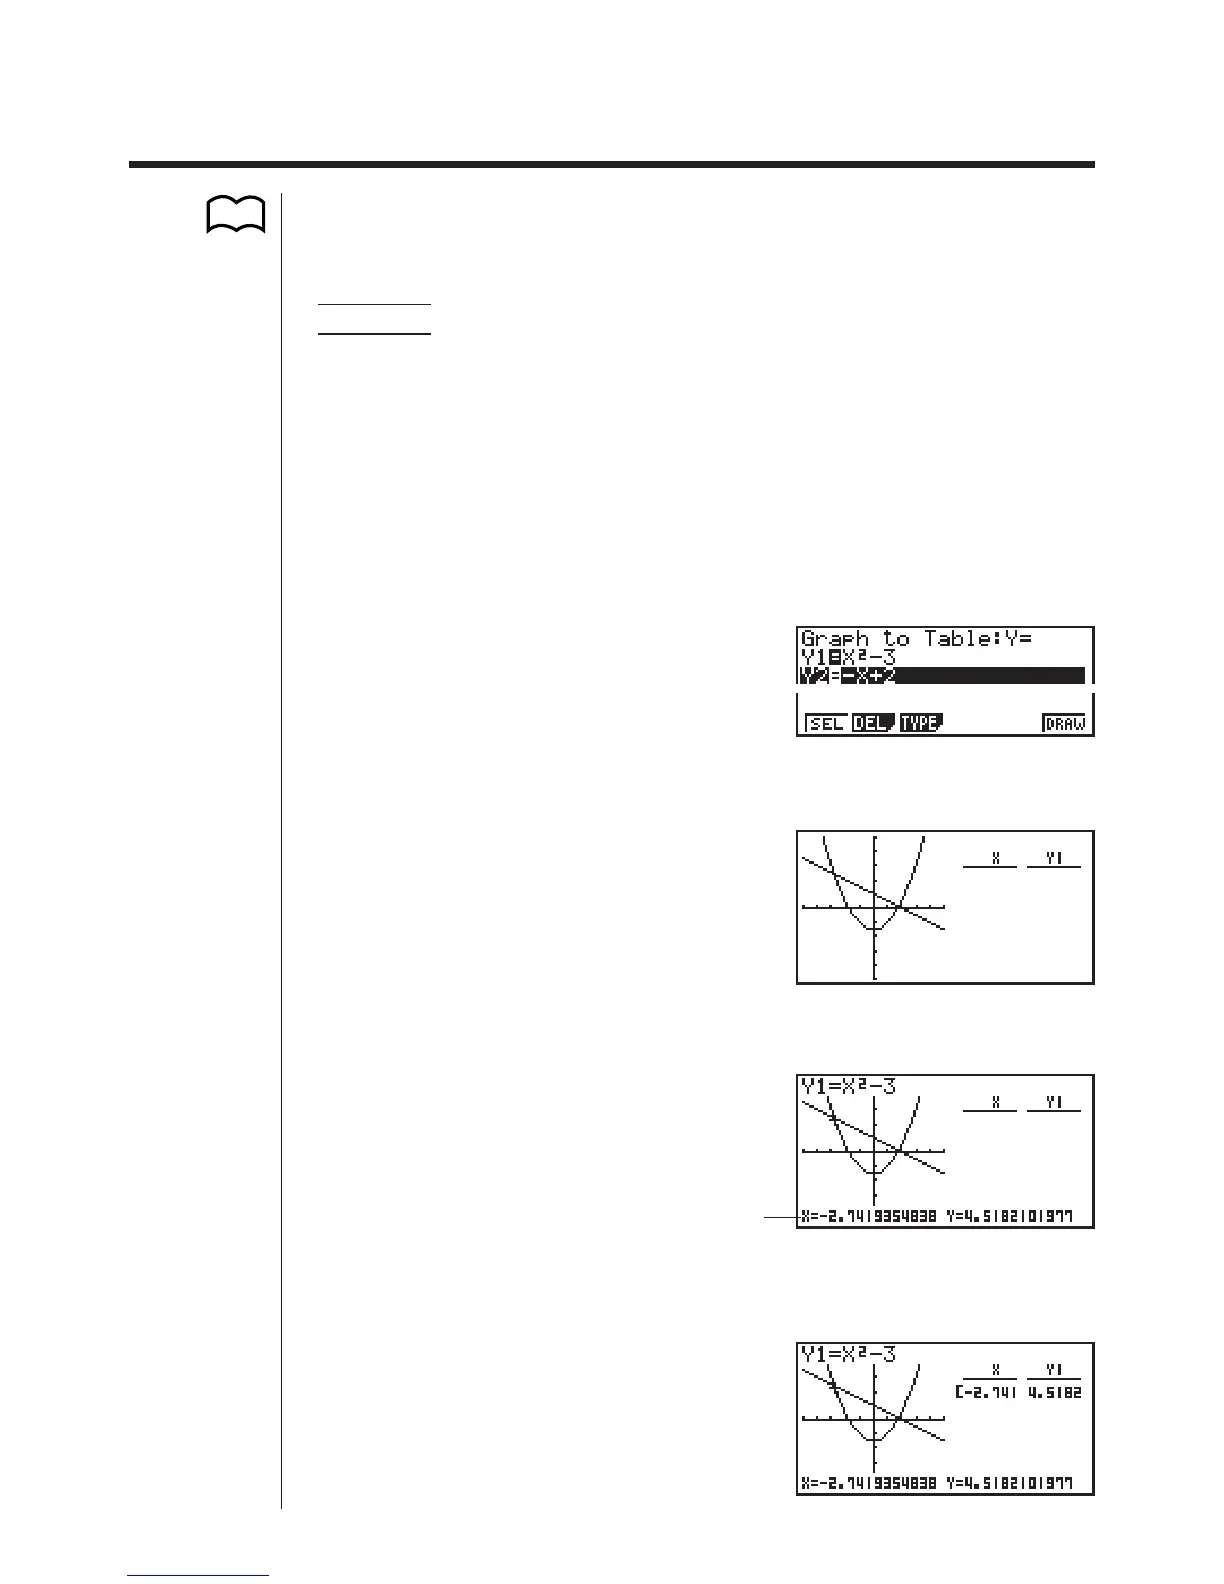
1. Input the two functions.
2. Press 6 (DRAW) to draw the graph in the left half of the screen.
6(DRAW) or w
3. Press 1 (Trace) and then use e to move the pointer to the first intersection.
1(Trace)
e~e
4. Press w to store the coordinates of the pointer location in the table on the right
side of the screen.
w
P.6
123456
x
/
y
-coordinate value