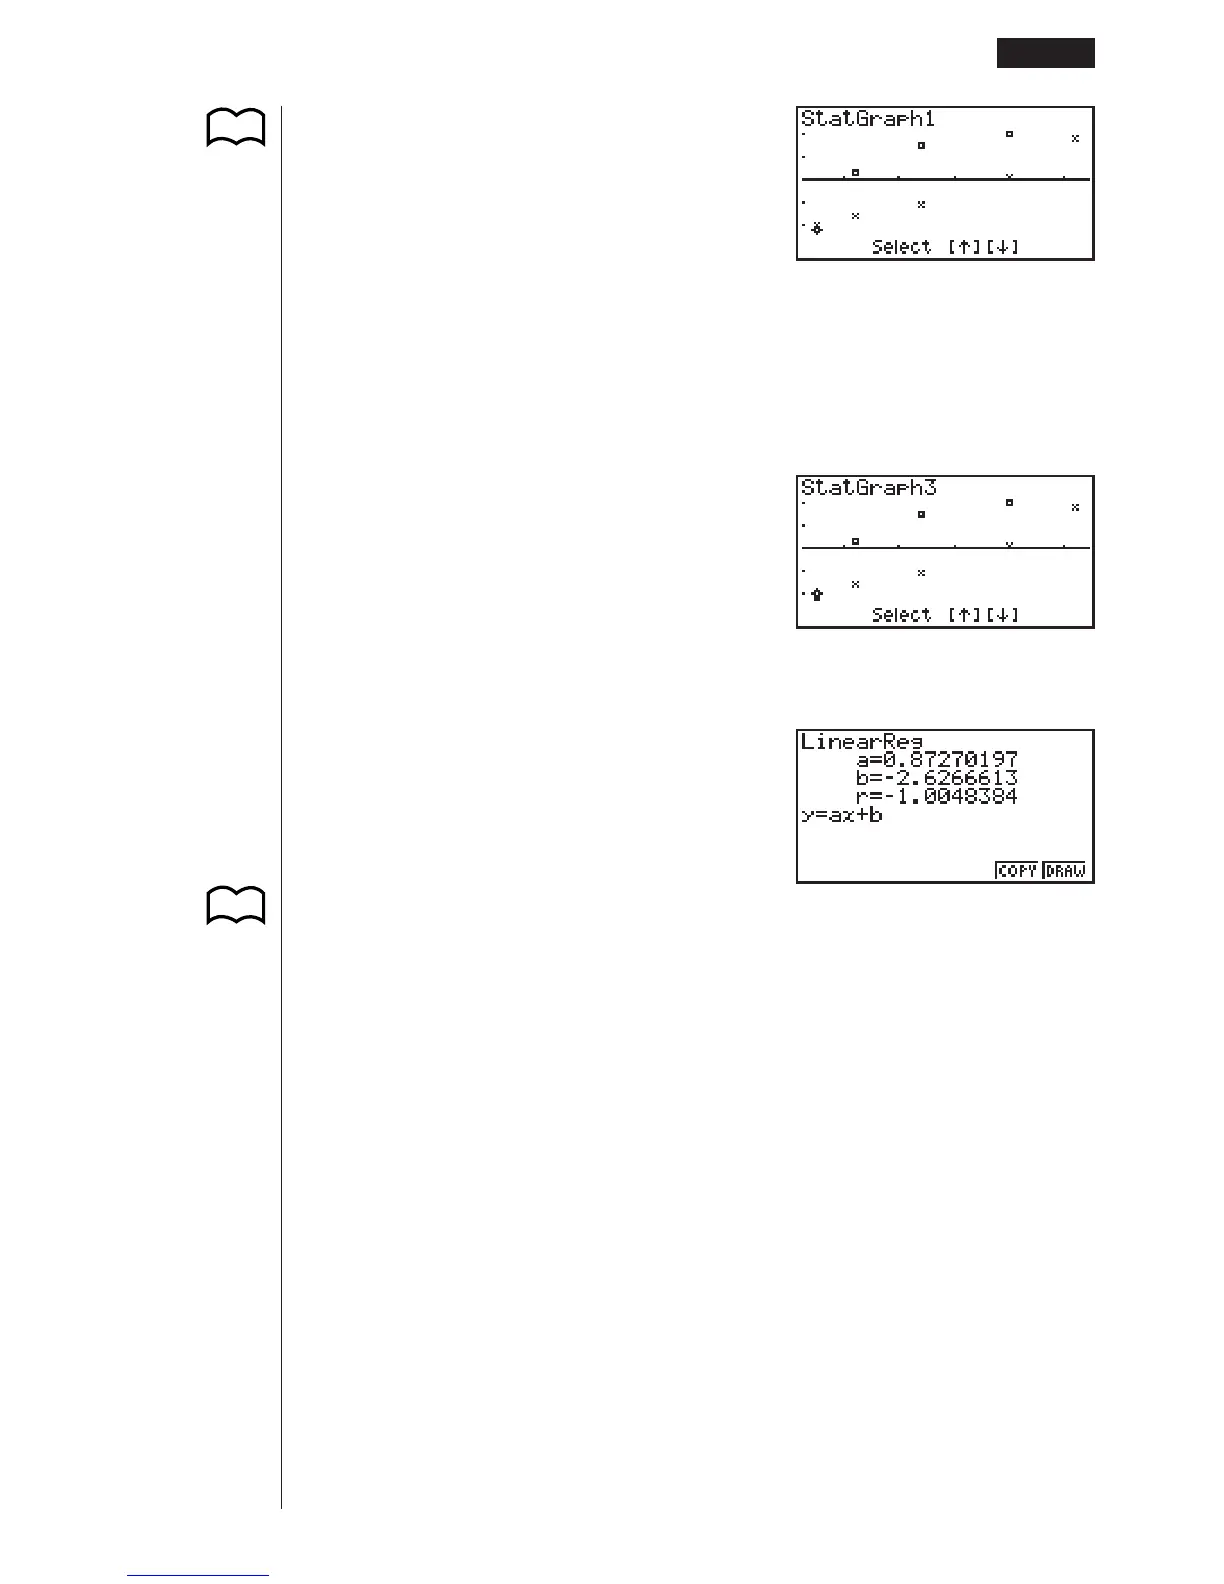
EasyManuals Logo

Casio FX-9750G User Manual

Casio FX-9750G
436 pages
To Next Page IconTo Next Page
To Previous Page IconTo Previous Page
Page #323 background imageLoading...
Page #323 background image
303
6(DRAW)
1(X)
The text at the top of the screen indicates the currently selected graph (StatGraph1
= Graph 1, StatGraph2 = Graph 2, StatGraph3 = Graph 3).
1. Use f and c to change the currently selected graph. The graph name at the
top of the screen changes when you do.
c
2. When graph you want to use is selected, press w.
Now you can use the procedures under “Displaying Single-Variable Statistical Re-
sults” and “Displaying Paired-Variable Statistical Results” to perform statistical cal-
culations.
P.296
P.301
Calculating and Graphing Paired-Variable Statistical Data 18 - 4
P.289

Table of Contents

Other manuals for Casio FX-9750G

Questions and Answers:

Question and Answer IconNeed help?

Do you have a question about the Casio FX-9750G and is the answer not in the manual?

Casio FX-9750G Specifications

General IconGeneral
Display TypeLCD
DisplayMonochrome
GraphingYes
Power Supply4 x AAA batteries
ProgrammingYes

Related product manuals