226
• Certain View Window parameters can make a circle graph come out looking like
an ellipse. When this happens, you can use the graph correction function (SQR)
to make corrections and produce a perfect circle.
(X – 3)
2
(Y – 1)
2
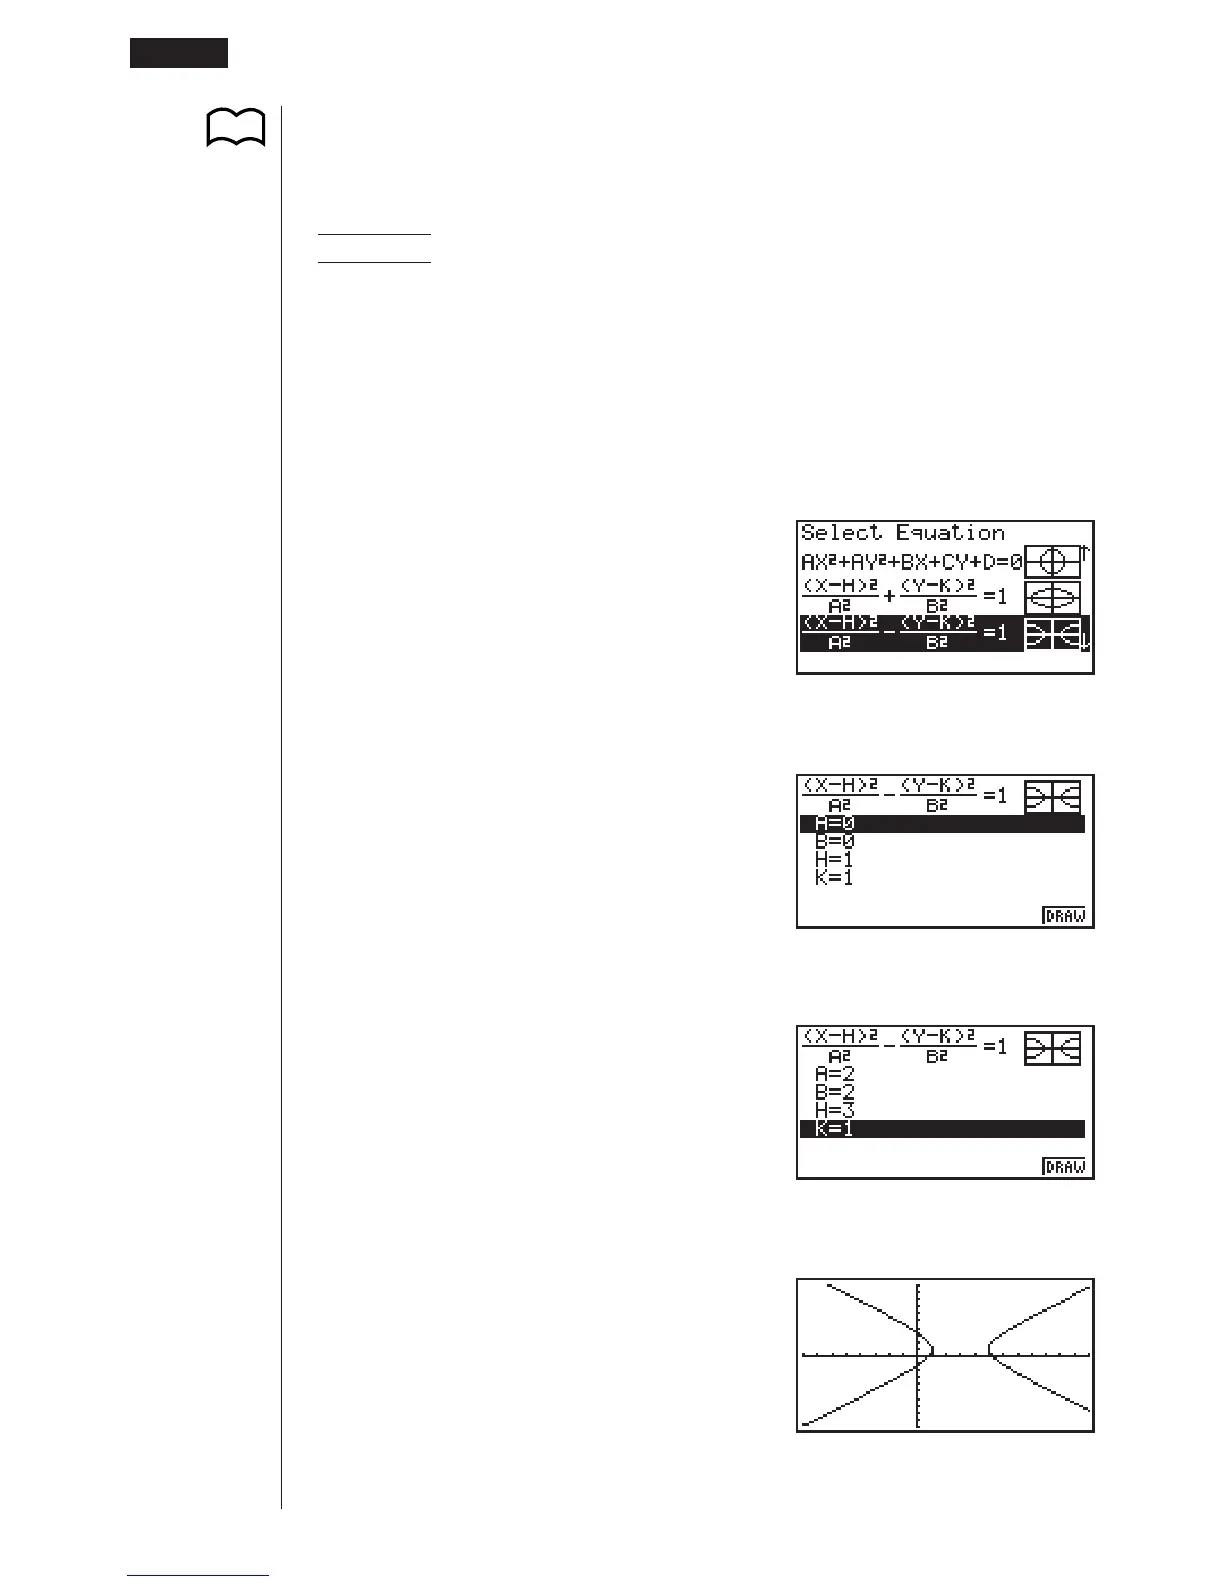
Example 2 To graph the hyperbola –––––––––– – –––––––––– = 1
2
2
2
2
Use the following View Window parameters.
Xmin = –8 Ymin = –10
Xmax = 12 Ymax = 10
Xscale = 1 Yscale = 1
1. Select the function whose graph you want to draw.
ccccccc
2. Press w and the variable input screen appears.
w
3. Assign values to each variable.
cw
cw
dw
bw
4. Press 6 (DRAW) to draw the graph.
6 (DRAW)
123456
P.155
14 - 2 Graphing an Implicit Function