232
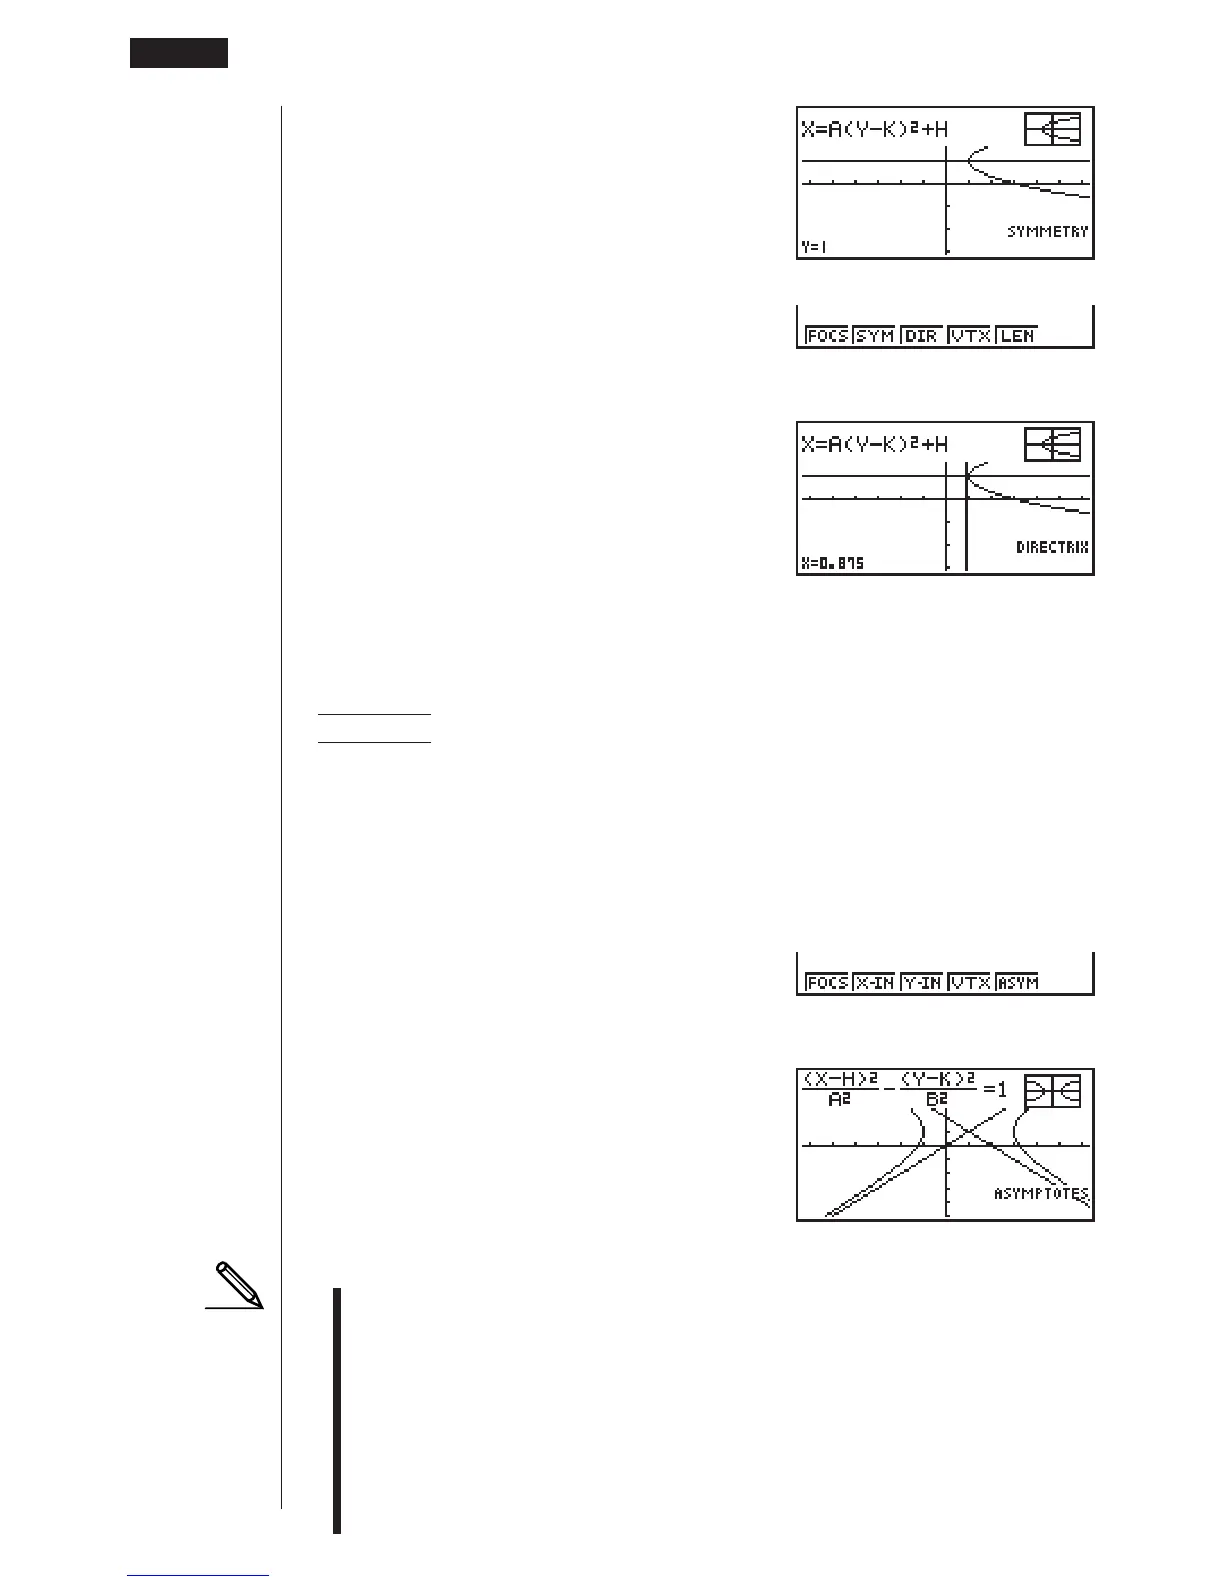
2 (SYM)
(Draws the axis of symmetry.)
5 (G-Solv)
3 (DIR)
(Draws the axis of directrix.)
uu
uu
uTo draw and analyze the asymptotes
Example To draw the asymptotes for the hyperbola
(X – 1)
2
(Y – 1)
2
–––––––––– – –––––––––– = 1
2
2
2
2
Use the following View Window parameters.
Xmin = –6.3 Ymin = –5
Xmax = 6.3 Ymax = 5
Xscale = 1 Yscale = 1
5 (G-Solv)
5 (ASYM)
(Draws the asymptotes.)
• Certain View Window parameters can produce errors in graph analysis result
values.
• The message ”Not Found” appears on the display when graph analysis is
unable to produce a result.
• The following can result in inaccurate analysis results or may even make it
impossible to obtain a solution at all.
• When the solution is tangent to the
x-axis.
• When the solution is a point of tangency between two graphs.
123 456
12345 6
14 - 3 Implicit Function Graph Analysis