247
uu
uu
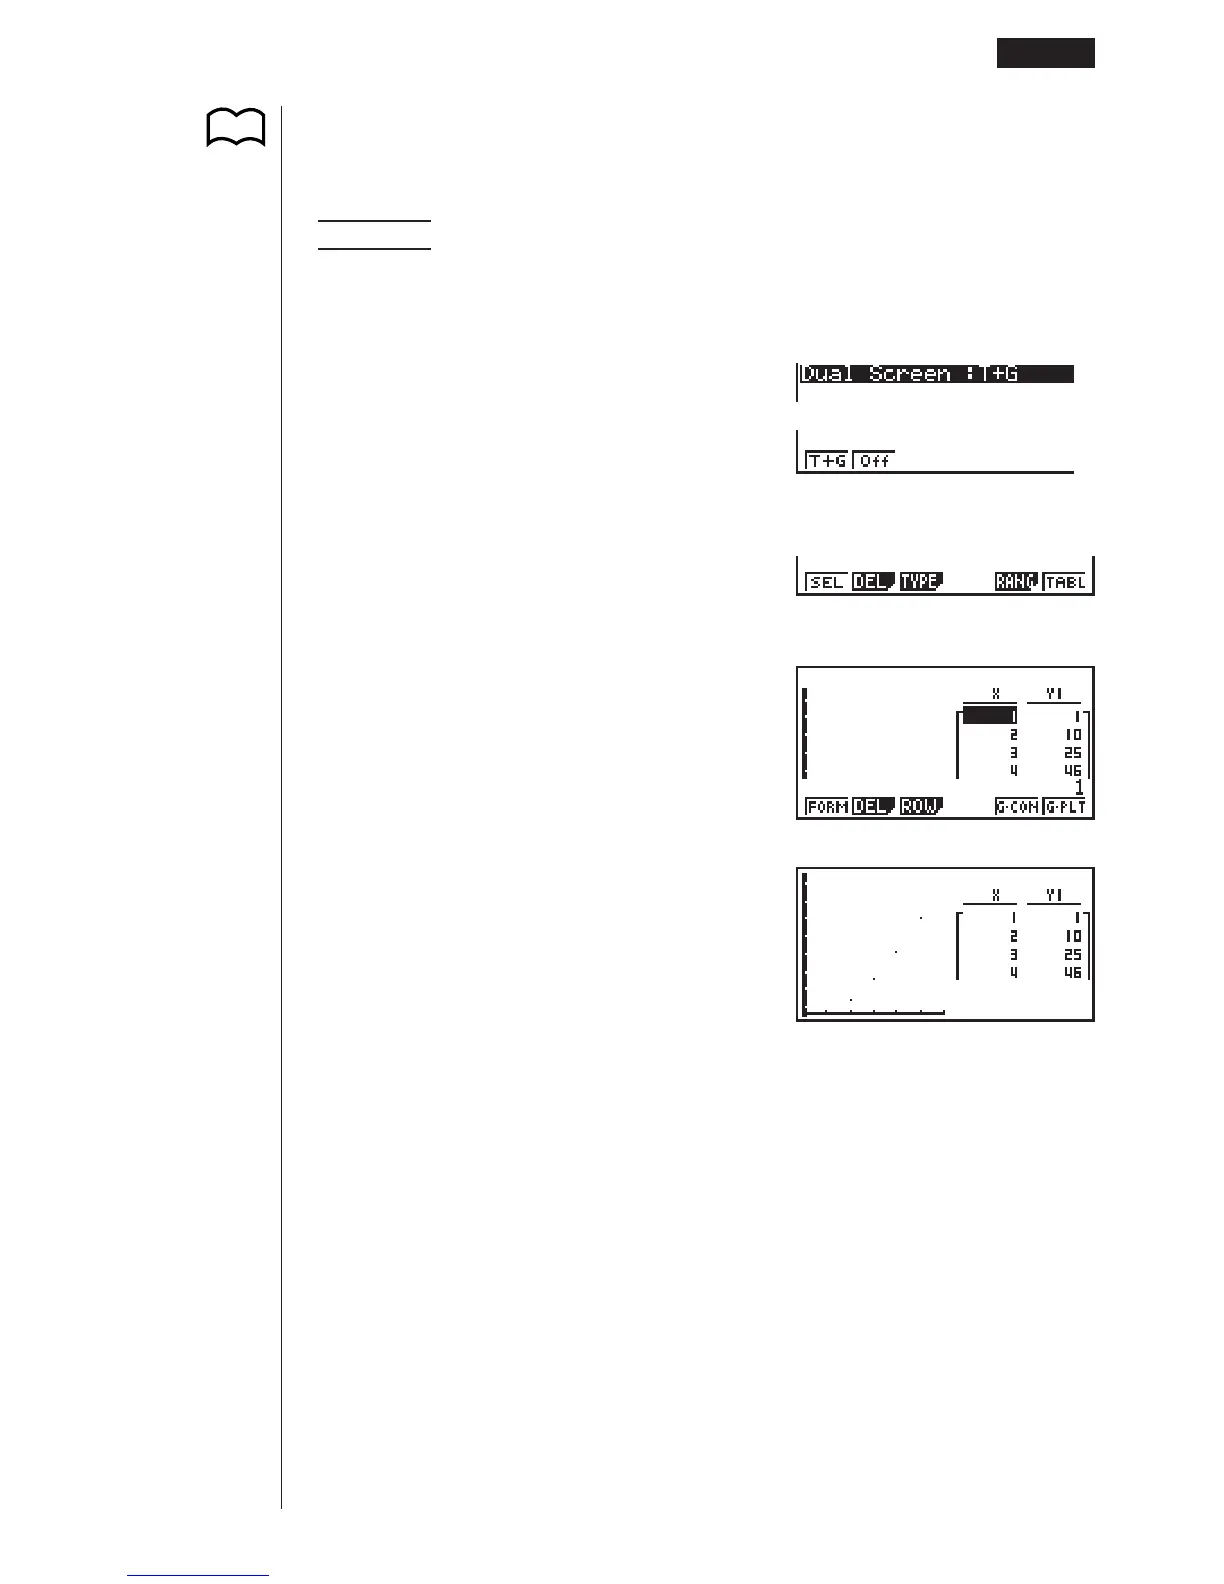
uTo graph a function using Dual Screen
Selecting “T+G” for the Dual Screen item of the set up screen makes it possible to
display both the graph and its numeric table of values.
Example To graph y = 3x
2
– 2 in memory are Y1, displaying both the graph
and its table
Use the same View Window parameters as in the example on page
245.
!Z
cc1(T+G)
(Specifies T+G for Dual Screen.)
J
6(TABL)
(Shows the table.)
6(G•PLT)
(Draws plot type graph.)
• Pressing !6 (G!T) causes the graph on the left side of the Dual Screen to
fill the entire display. Note that you cannot use the sketch function while a graph
is displayed using !6 (G!T).
P.8
Editing Tables and Drawing Graphs 15 - 4
1 23456
123456
123456