309
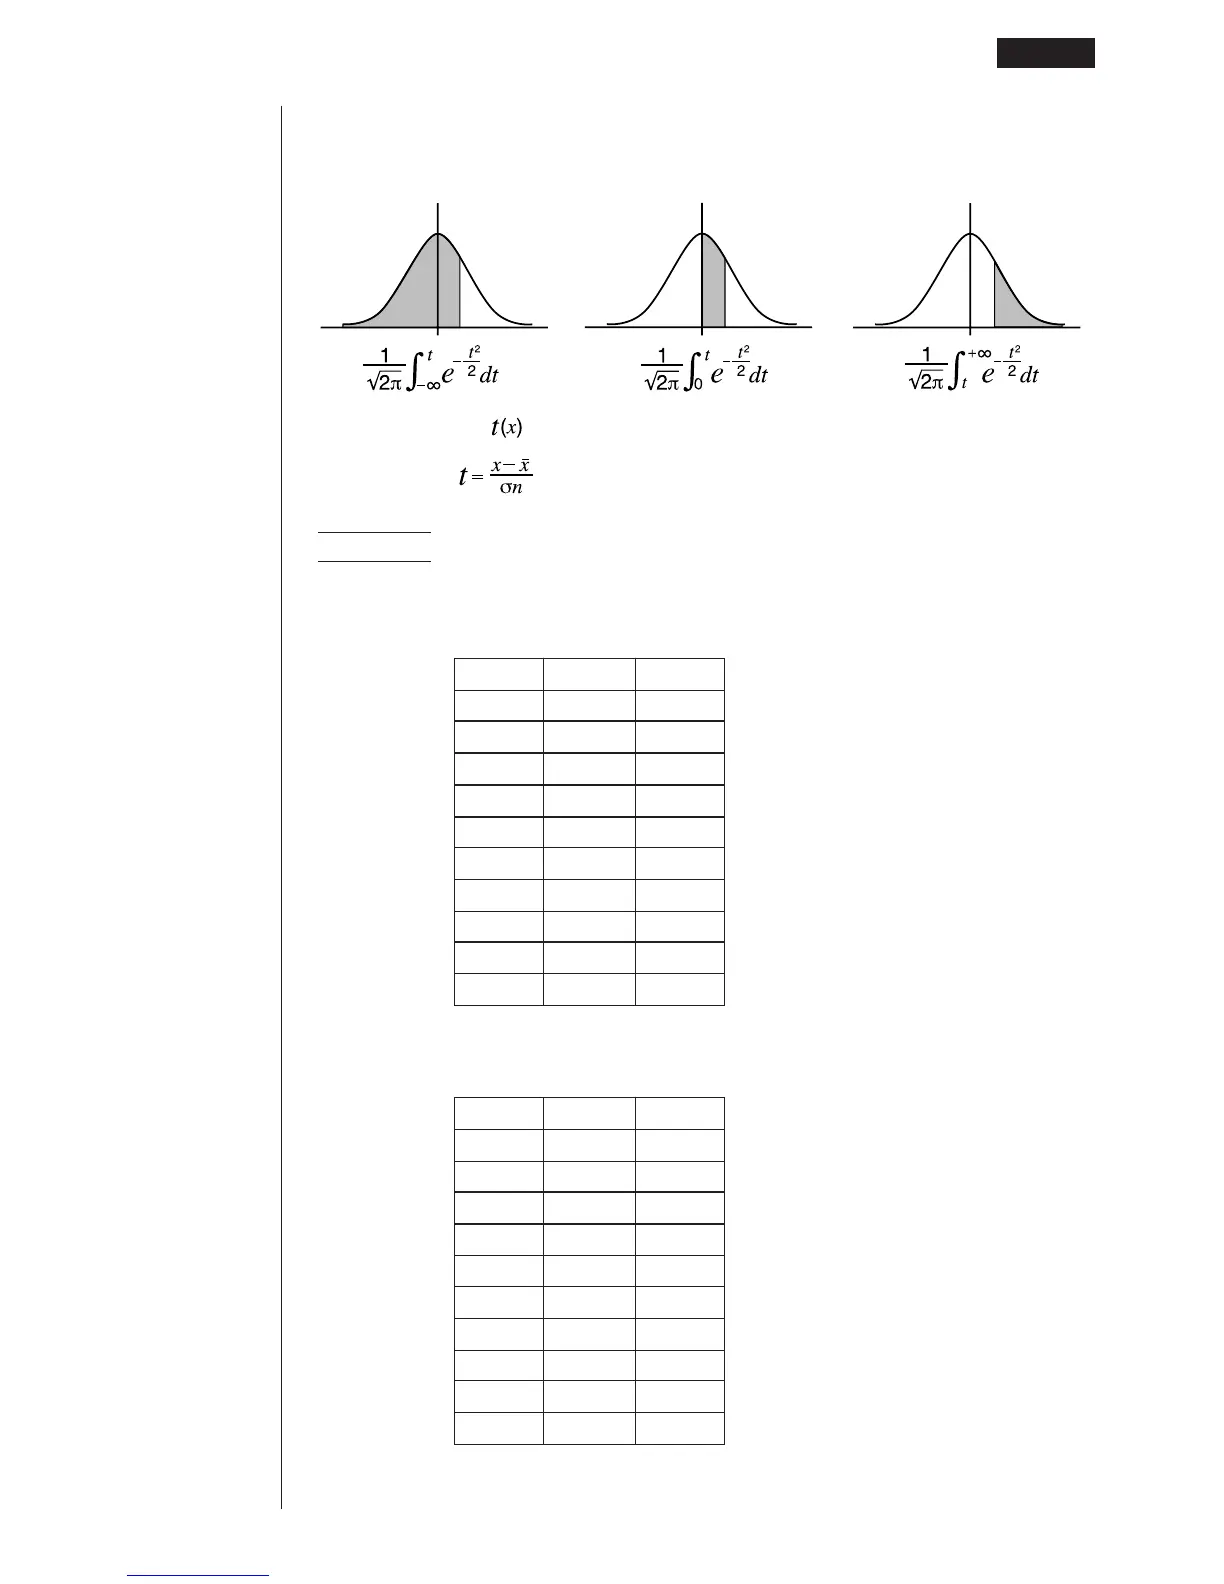
• Probability P(
t), Q(t), and R(t), and normalized variate t(x) are calculated using
the following formulas.
Example The following table shows the results of measurements of the
height of 20 college students. Determine what percentage of the
students fall in the range 160.5 cm to 175.5 cm. Also, in what
percentile does the 175.5 cm tall student fall?
Class no. Height (cm) Frequency
1 158.5 1
2 160.5 1
3 163.3 2
4 167.5 2
5 170.2 3
6 173.3 4
7 175.5 2
8 178.6 2
9 180.4 2
10 186.7 1
1. In the STAT Mode, input the height data into List 1 and the frequency data into
List 2.
List 1 List 2
1 158.5 1
2 160.5 1
3 163.3 2
4 167.5 2
5 170.2 3
6 173.3 4
7 175.5 2
8 178.6 2
9 180.4 2
10 186.7 1
P(t) Q(t) R(t)
Performing Statistical Calculations 18 - 6