360
• The following is a typical graph condition specification for a scatter diagram or
x,
y line graph.
S-Gph1 DrawOn, Scatter, List1, List2, 1, Square_
In the case of an x, y line graph, replace “Scatter” in the above specification with
“xyLine”.
• The following is a typical graph condition specification for a single-variable graph.
S-Gph1 DrawOn, Hist, List1, List2_
The same format can be used for the following types of graphs, by simply replac-
ing “Hist” in the above specification with the applicable graph type.
Histogram: ...................... Hist
Median Box: ................... MedBox
Mean Box: ...................... MeanBox
Normal Distribution: ........ N-Dist
Broken Line: ................... Broken
• The following is a typical graph condition specification for a regression graph.
S-Gph1 DrawOn, Linear, List1, List2, List3_
The same format can be used for the following types of graphs, by simply replac-
ing “Linear” in the above specification with the applicable graph type.
Linear Regression: ......... Linear
Med-Med: ....................... Med-Med
Quadratic Regression: .... Quad
Cubic Regression: .......... Cubic
Quartic Regression : ...... Quart
Logarithmic Regression: .. Log
Exponential Regression: Exp
Power Regression : ........Power
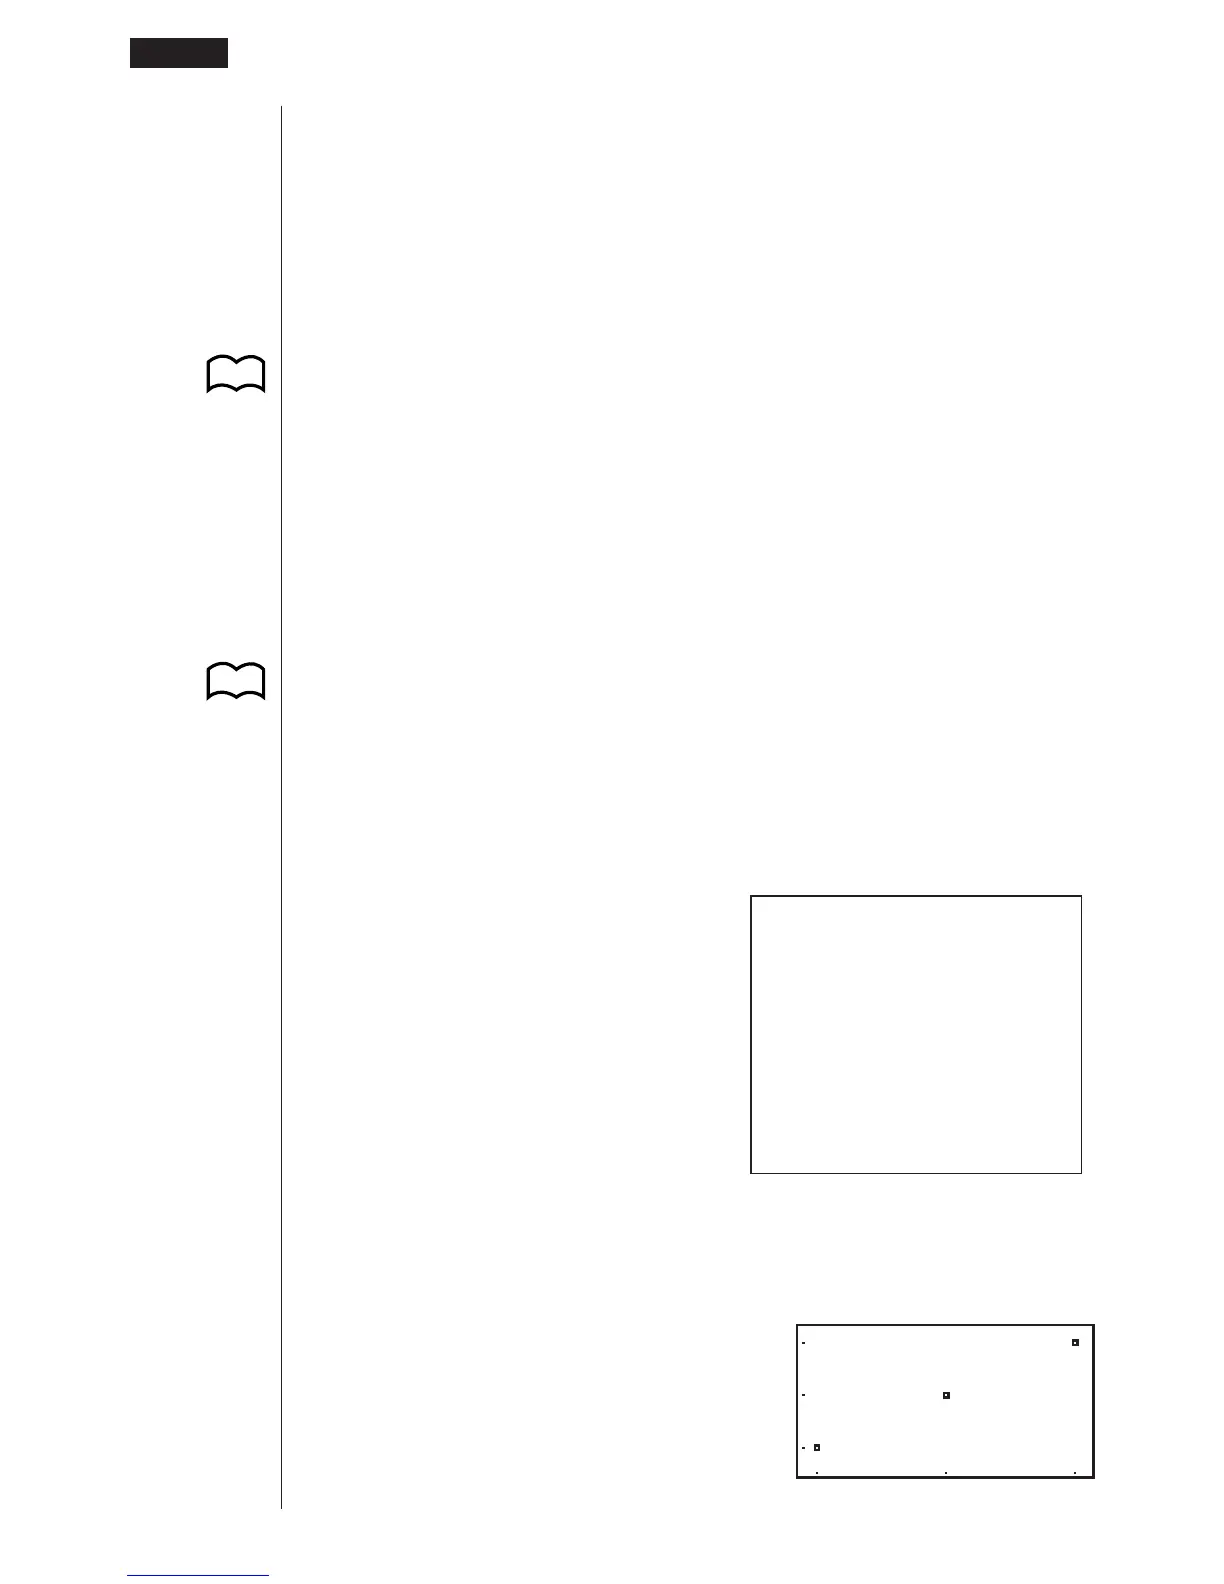
Example Program
ClrGraph_
S-Wind Auto_
{1, 2, 3} # List 1_
{1, 2, 3} # List 2_
S-Gph1 DrawOn, Scatter, List1, List2, 1, Square_
DrawStat
Executing this program produces the scatter diagram shown here.
19
-
13 Using Calculator Functions in Programs
P.289
P.289
3
8
2
5 6 74
1
1
!Z6631
2
K11
3
1JJ
4
4121J
5
11J
6
24J
7
J41
8
!W621