LPOD Outdoor Amplifier / Block Up Converter Revision 9
Ethernet-based Remote Product Management MN-LPOD
4–33
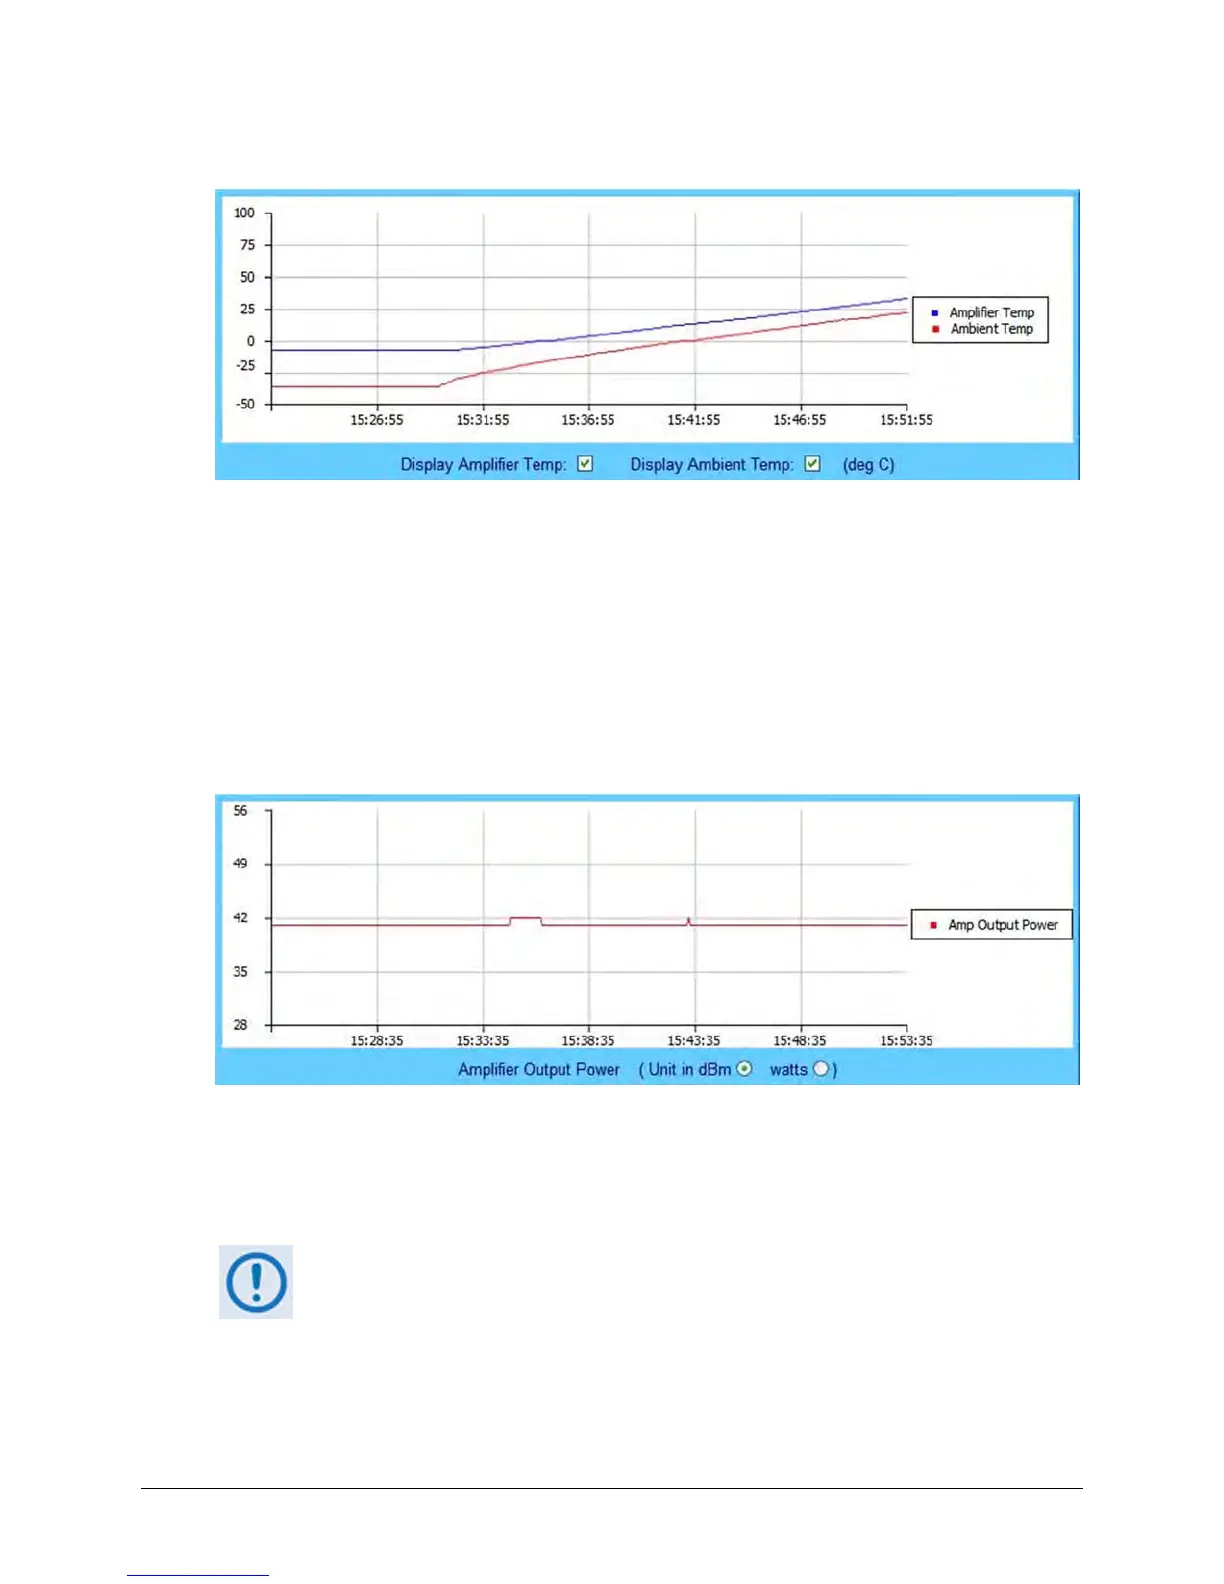
Temperature Graph
As noted by the graph legend, the blue line displays the unit's Amplifier (heat sink) temperature;
the red line displays the Ambient (outdoor) temperature, if the required sensor has been
installed in the unit.
You may control the appearance of either temperature by deselecting the pertinent checkbox
provided at the bottom of the graph. The graph will dynamically update after the next polling
cycle (every five seconds), when the deselected parameter is removed from both the graph and
its legend.
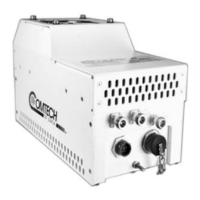
Power Graph
The power graph displays the unit's output power with 1dB resolution. You may define whether
the graph depicts the unit of measurement as dBm (the default setting) or watts by selecting
the desired Amplified Output Power unit at the bottom of the graph. The graph will dynamically
update after the next polling cycle (every five seconds) to the desired parameter.
If the [Refresh] tab is clicked, the graph will revert to the default display (Unit in
dBm).