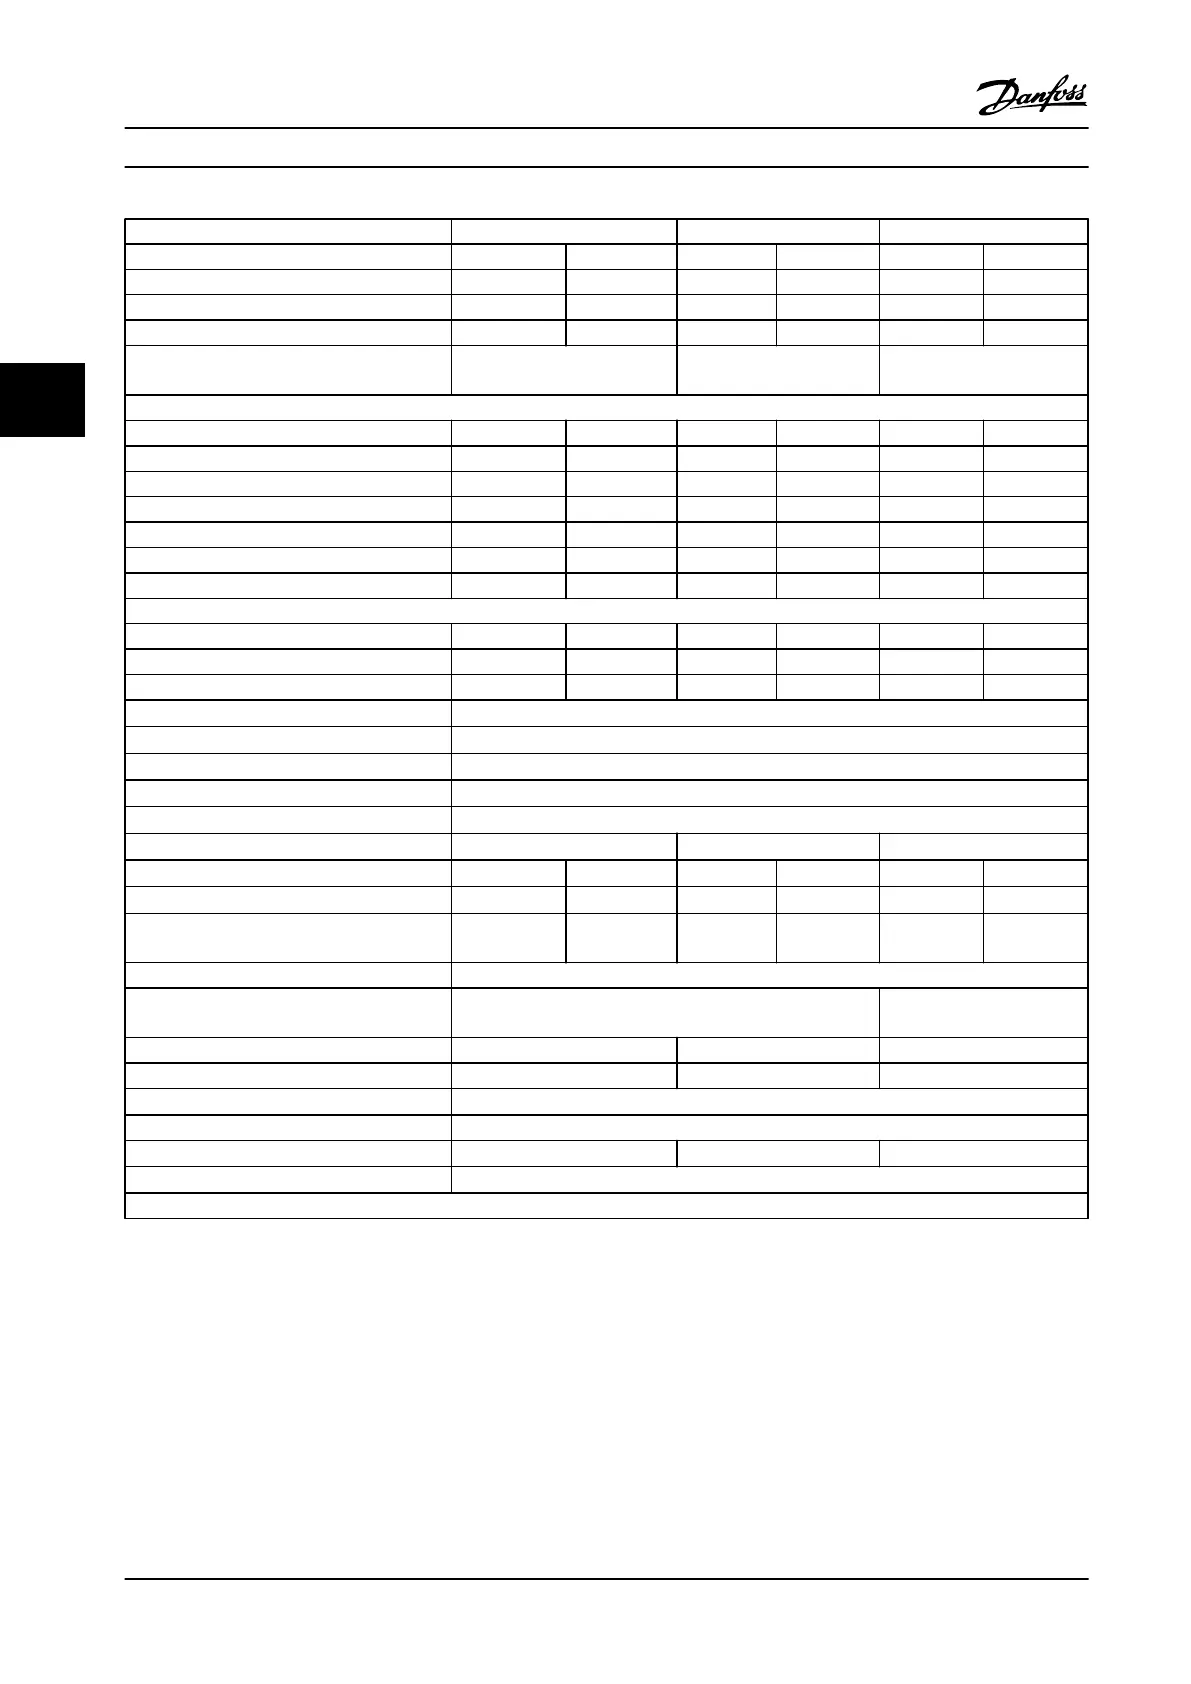
FC 302 P900 P1M0 P1M2
High/Normal load* HO NO HO NO HO NO
Typical shaft output at 550 V [kW] 750 850 850 1000 1000 1100
Typical shaft output at 575 V [HP] 1050 1150 1150 1350 1350 1550
Typical shaft output at 690 V [kW] 900 1000 1000 1200 1200 1400
Enclosure IP21, IP54 without/with options
cabinet
F2/F4 F2/F4 F2/F4
Output current
Continuous (at 550 V) [A] 988 1108 1108 1317 1317 1479
Intermittent (60 s overload) (at 550 V) [A] 1482 1219 1662 1449 1976 1627
Continuous (at 575/690 V) [A] 945 1060 1060 1260 1260 1415
Intermittent (60 s overload) (at 575/690 V) [A] 1418 1166 1590 1386 1890 1557
Continuous KVA (at 550 V) [KVA] 941 1056 1056 1255 1255 1409
Continuous KVA (at 575 V) [KVA] 941 1056 1056 1255 1255 1409
Continuous KVA (at 690 V) [KVA] 1129 1267 1267 1506 1506 1691
Maximum input current
Continuous (at 550 V) [A] 962 1079 1079 1282 1282 1440
Continuous (at 575 V) [A] 920 1032 1032 1227 1227 1378
Continuous (at 690 V) [A] 920 1032 1032 1227 1227 1378
Max. cable size, motor [mm
2
(AWG)
1)
]
12x150 (12x300 mcm)
Max. cable size, line power F2 [mm
2
(AWG)
1)
]
8x240 (8x500 mcm)
Max. cable size, line power F4 [mm
2
(AWG)
1)
]
8x456 (8x900 mcm)
Max. cable size, load sharing [mm
2
(AWG)
1)
]
4x120 (4x250 mcm)
Max. cable size, brake [mm
2
(AWG)
1)
]
6x185 (6x350 mcm)
Max. external electrical fuses [A]
2)
1600 2000 2500
Estimated power loss at 600 V [W]
3)
4)
12062 13731 13269 16190 16089 18536
Estimated power loss at 690 V [W]
3)
4)
12524 14250 13801 16821 16719 19247
F3/F4 Max added losses CB or disconnect &
contactor
556 665 634 863 861 1044
Max panel options losses 400
Weight,
enclosure IP21, IP54 (lb [kg])
1260/1561 1294/1595
Weight, rectifier module [kg] 136 136 136
Weight, inverter module [kg] 102 102 136
Efficiency
4)
0.98
Output frequency 0–500 Hz
Heatsink overtemp. trip
203 °F [95 °C] 221 °F [105 °C] 203 °F [95 °C]
Power card ambient trip
185 °F [85 °C[
* High overload=160% torque during 60 s, Normal overload=110% torque during 60 s.
Table 4.11 Technical Specifications, F2/F4 frames, 525–690 V Line Power Supply 3x525–690 V AC
1) American Wire Gauge.
2) For fuse ratings, see chapter 7.2.1 Fuses.
3) Typical power loss is at normal conditions and expected to be within
±
15% (tolerance relates to variety in voltage and cable conditions.) These
values are based on a typical motor efficiency (IE/IE3 border line). Lower efficiency motors add to the power loss in the adjustable frequency drive.
If the switching frequency is raised from nominal, the power losses rise significantly. LCP and typical control card power consumptions are
included. Options and customer load can add up to 30 W to the losses, though usually a fully loaded control card and options for slots A and B
each add only 4 W.
4) Measured using 16.5 ft. [5 m] shielded motor cables at rated load and rated frequency.
Selection
Design Guide
74 Danfoss A/S © Rev. 2014-02-10 All rights reserved. MG34S222
44
 Loading...