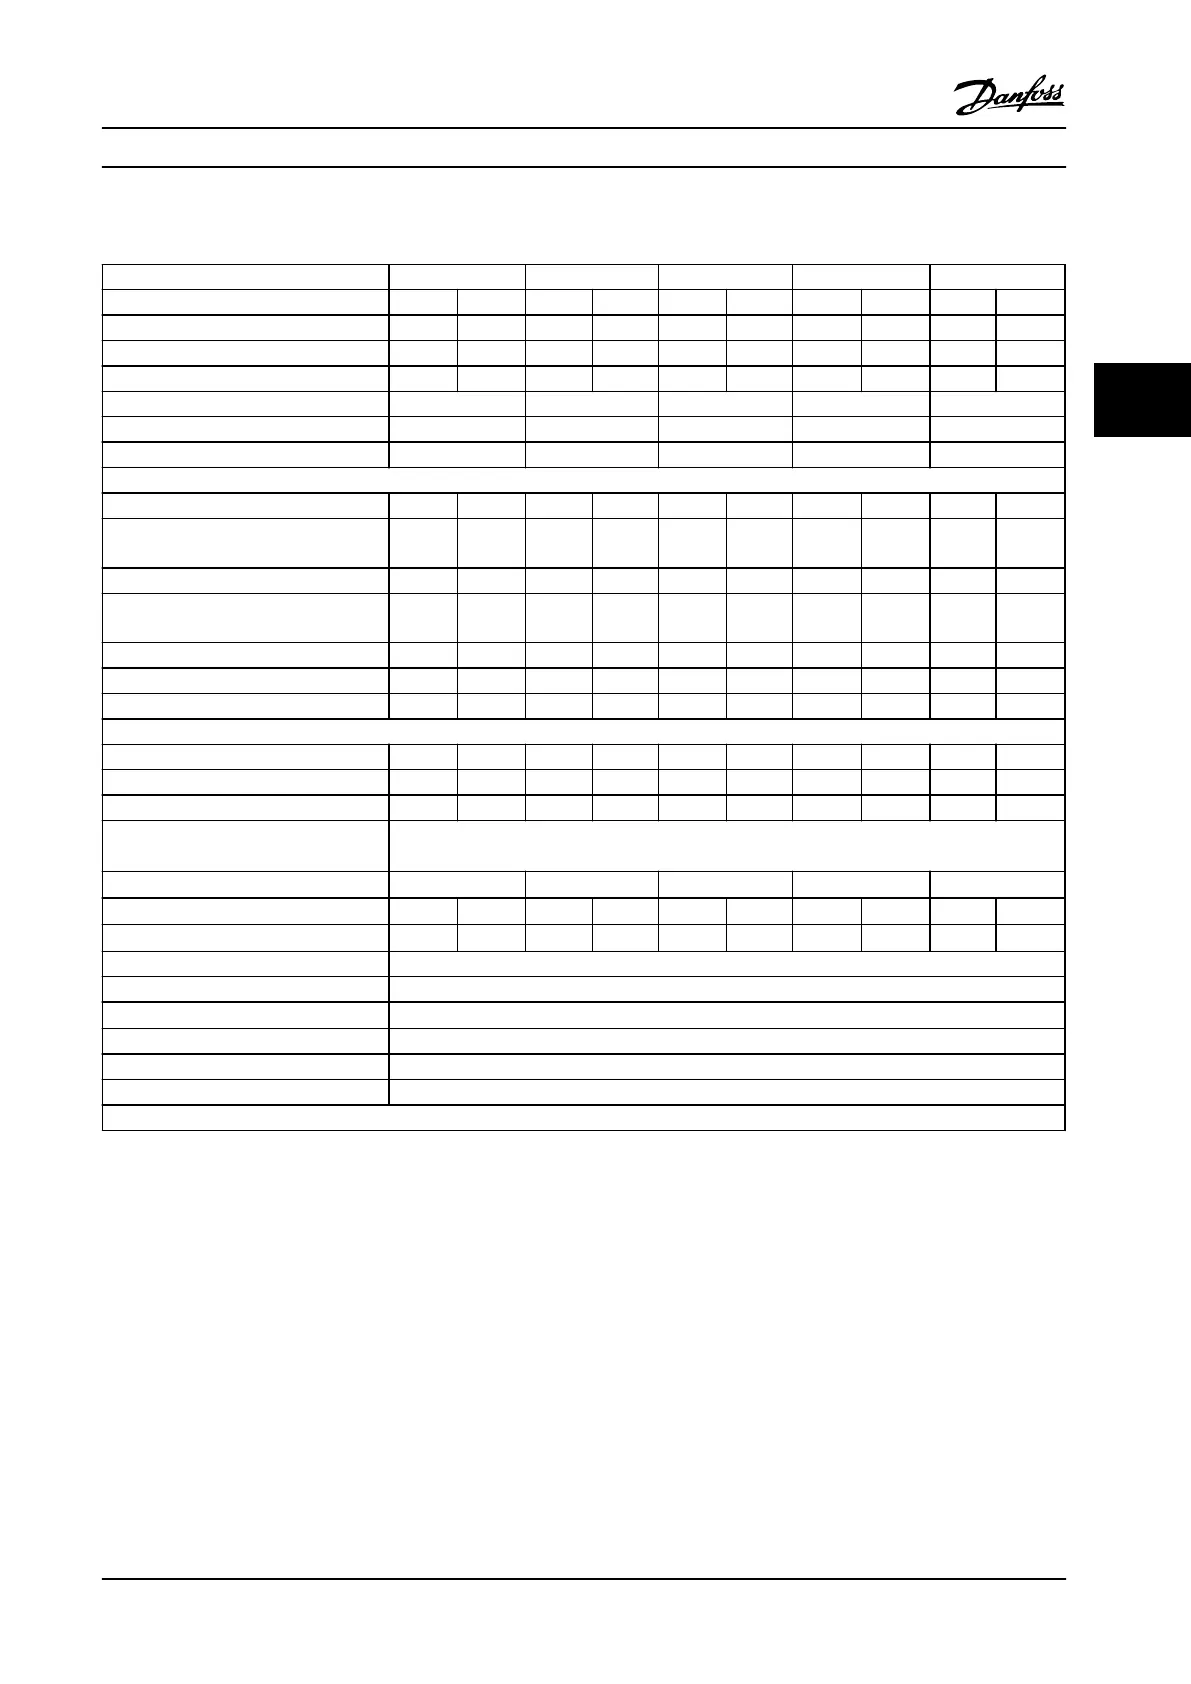
4.2 Electrical Data, 525–690 V
FC 302 N55K N75K N90K N110 N132
High/Normal load* HO NO HO NO HO NO HO NO HO NO
Typical shaft output at 550 V [kW] 45 55 55 75 75 90 90 110 110 132
Typical shaft output at 575 V [hp] 60 75 75 100 100 125 125 150 150 200
Typical shaft output at 690 V [kW] 55 75 75 90 90 110 110 132 132 160
Enclosure IP21 D1h D1h D1h D1h D1h
Enclosure IP54 D1h D1h D1h D1h D1h
Enclosure IP20 D3h D3h D3h D3h D3h
Output current
Continuous (at 550 V) [A] 76 90 90 113 113 137 137 162 162 201
Intermittent (60 s overload) (at 550 V)
[A]
122 99 135 124 170 151 206 178 243 221
Continuous (at 575/690 V) [A] 73 86 86 108 108 131 131 155 155 192
Intermittent (60 s overload)
(at 575/690 V) [kVA]
117 95 129 119 162 144 197 171 233 211
Continuous kVA (at 550 V) [kVA] 72 86 86 108 108 131 131 154 154 191
Continuous kVA (at 575 V) [kVA] 73 86 86 108 108 130 130 154 154 191
Continuous kVA (at 690 V) [kVA] 87 103 103 129 129 157 157 185 185 229
Maximum input current
Continuous (at 550 V) [A] 77 89 89 110 110 130 130 158 158 198
Continuous (at 575 V) [A] 74 85 85 106 106 124 124 151 151 189
Continuous (at 690 V) 77 87 87 109 109 128 128 155 155 197
Max. cable size: line power, motor,
brake and load share mm
2
(AWG)
1)
2x95 (2x3/0)
Max. external electrical fuses [A]
2)
160 315 315 315 315
Estimated power loss at 575 V [W]
3)
4)
1098 1162 1162 1428 1430 1740 1742 2101 2080 2649
Estimated power loss at 690 V [W]
3)
4)
1057 1204 1205 1477 1480 1798 1800 2167 2159 2740
Weight, enclosure IP21, IP54 kg (lbs) 62 (135)
Weight, enclosure IP20 kg (lbs) 125 (275)
Efficiency
4)
0.98
Output frequency 0–590 Hz
Heatsink overtemperature trip 230 °F [110 °C]
Control card ambient trip 167 °F [75 °C]
*High overload=150% current for 60 s, Normal overload=110% current for 60 s.
Table 4.6 Technical Specifications, D-frame, 525–690 V Line Power Supply 3x525–690 V AC
1) American Wire Gauge.
2) For fuse ratings, see chapter 7.2.1 Fuses.
3) Typical power loss is at normal conditions and expected to be within
±
15% (tolerance relates to variety in voltage and cable conditions.) These
values are based on a typical motor efficiency (IE/IE3 border line). Lower efficiency motors add to the power loss in the adjustable frequency drive.
If the switching frequency is raised from nominal, the power losses rise significantly. LCP and typical control card power consumptions are
included. Options and customer load can add up to 30 W to the losses, though usually a fully loaded control card and options for slots A and B
each add only 4 W.
4) Measured using 16.5 ft. [5 m] shielded motor cables at rated load and rated frequency.
Selection
Design Guide
MG34S222 Danfoss A/S © Rev. 2014-02-10 All rights reserved. 69
4 4
 Loading...