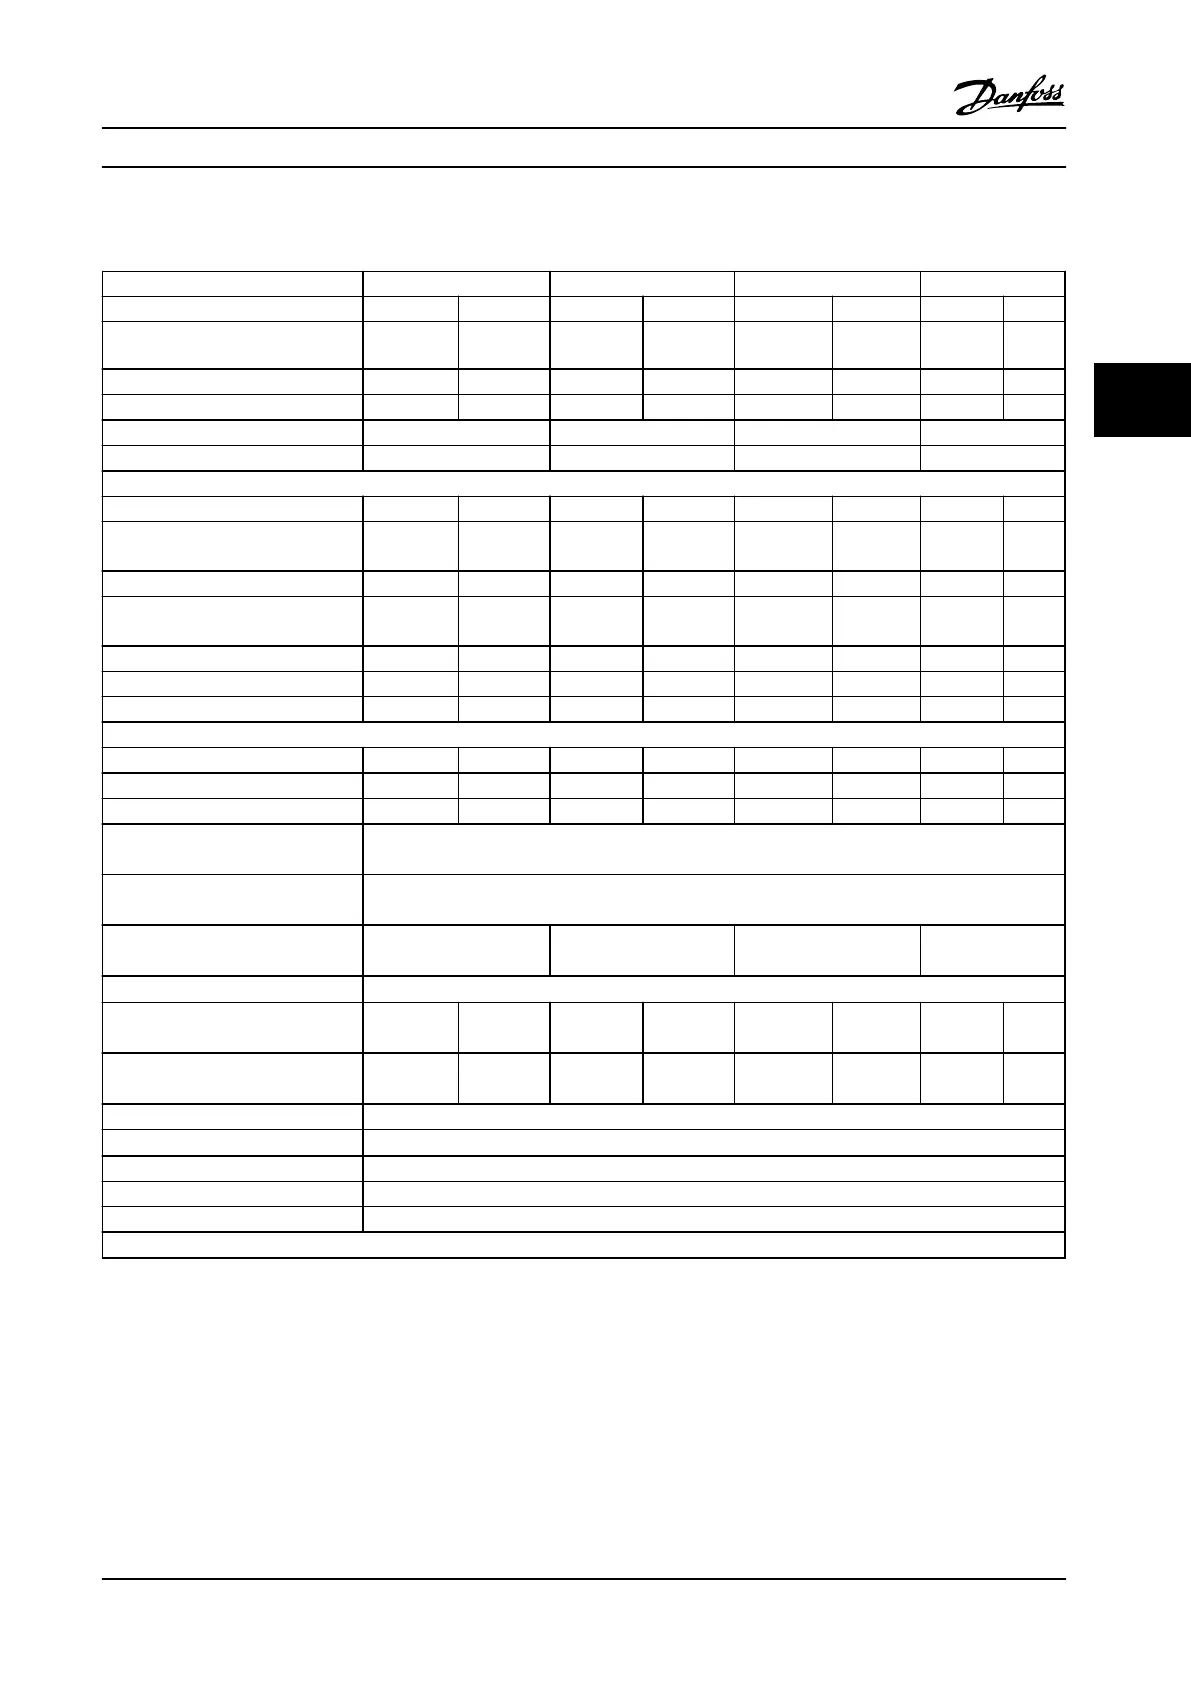
4.2.1 Electrical Data, 525–690 V AC, 12-Pulse
FC 302 P355 P400 P500 P560
High/Normal load HO NO HO NO HO NO HO NO
Typical shaft output at 550 V [kW]
315 355 315 400 400 450 450 500
Typical shaft output at 575 V [HP] 400 450 400 500 500 600 600 650
Typical shaft output at 690 V [kW] 355 450 400 500 500 560 560 630
Enclosure IP21 F8/F9 F8/F9 F8/F9 F8/F9
Enclosure IP54 F8/F9 F8/F9 F8/F9 F8/F9
Output current
Continuous (at 550 V) [A] 395 470 429 523 523 596 596 630
Intermittent (60 s overload)
(at 550 V) [A]
593 517 644 575 785 656 894 693
Continuous (at 575/690 V) [A] 380 450 410 500 500 570 570 630
Intermittent (60 s overload) (at
575/690 V) [A]
570 495 615 550 750 627 855 693
Continuous KVA (at 550 V) [KVA] 376 448 409 498 498 568 568 600
Continuous KVA (at 575 V) [KVA] 378 448 408 498 498 568 568 627
Continuous KVA (at 690 V) [KVA] 454 538 490 598 598 681 681 753
Maximum input current
Continuous (at 550 V) [A] 381 453 413 504 504 574 574 607
Continuous (at 575 V) [A] 366 434 395 482 482 549 549 607
Continuous (at 690 V) [A] 366 434 395 482 482 549 549 607
Max. cable size, line power
[mm
2
(AWG)
1)
]
4x85 (3/0)
Max. cable size, motor
[mm
2
(AWG)
1)
]
4x250 (500 mcm)
Max. cable size, brake
[mm
2
(AWG)
1)
]
2x185 (2x350 mcm) 2x185 (2x350 mcm) 2x185 (2x350 mcm) 2x185 (2x350 mcm)
Max. external electrical fuses [A]
2)
630
Estimated power loss at
600 V [W]
3)
4)
4424 5323 4795 6010 6493 7395 7383 8209
Estimated power loss at
690 V [W]
3)
4)
4589 5529 4970 6239 6707 7653 7633 8495
Weight, enclosure IP21, IP54 [kg] 447/669
Efficiency
4)
0.98
Output frequency 0–500 Hz
Heatsink overtemp. trip 230 °F [110 °C]
Power card ambient trip 185 °F [85 °C]
* High overload=160% torque during 60 s, Normal overload=110% torque during 60 s.
Table 4.12 Technical Specifications F8/F9 frames, 525–690 V Line Power Supply 6x525–690 V AC, 12-Pulse
1) American Wire Gauge.
2) For fuse ratings, see chapter 7.2.1 Fuses.
3) Typical power loss is at normal conditions and expected to be within
±
15% (tolerance relates to variety in voltage and cable conditions.) These
values are based on a typical motor efficiency (IE/IE3 border line). Lower efficiency motors add to the power loss in the adjustable frequency drive.
If the switching frequency is raised from nominal, the power losses rise significantly. LCP and typical control card power consumptions are
included. Options and customer load can add up to 30 W to the losses, though usually a fully loaded control card and options for slots A and B
each add only 4 W.
4) Measured using 16.5 ft. [5 m] shielded motor cables at rated load and rated frequency.
Selection
Design Guide
MG34S222 Danfoss A/S © Rev. 2014-02-10 All rights reserved. 75
4 4
 Loading...