H50/H51 Hematology Analyzer User Manual QC
- 27 -
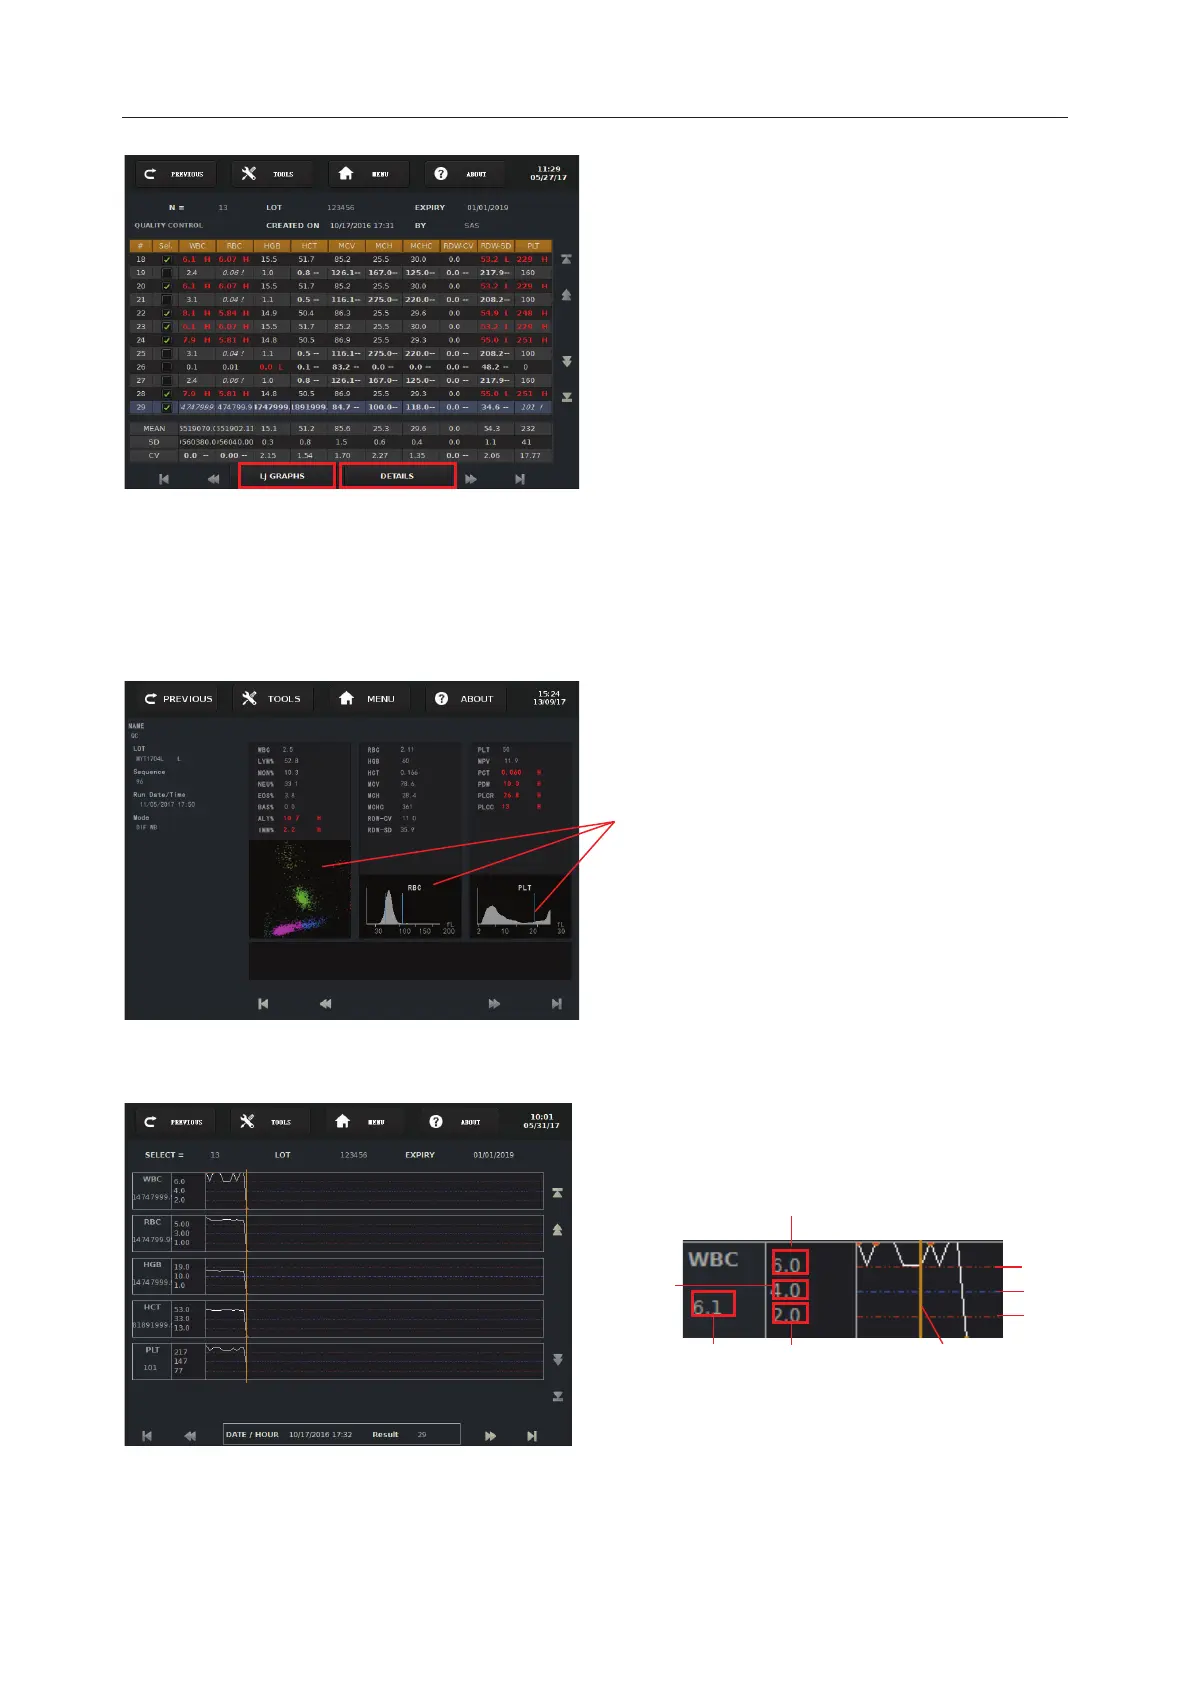
Screen 7-3
QC results can be viewed in Table mode as displayed in Screen 7-3. But the results can also be
viewed in Details mode by pressing “DETAILS” to enter into Screen 7-4 or in LJ Graphs mode
by pressing “LJ GRAPHS” to enter into Screen 7-5.
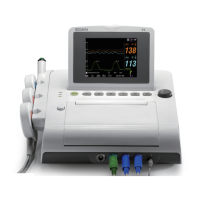
Screen 7-4
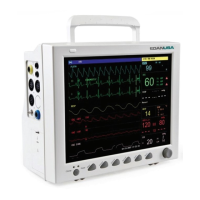
Screen 7-5
The Screen 7-3 is mainly used to perform
QC test and view the test results.
Under the screen, the sampling needle will
move down to aspirate the prepared QC
materials by pushing the
start key
and then
the system will automatically finish the
whole analysis and display the test results
on the screen.
Take WBC for instance to explain how to interpret the
LJ GRAPHS
:
The position of yellow line represents a QC test.
Therefore the test result varies as the yellow
line’s position changes.
These pictures can be enlarged respectively
by pressing them.