Chapter 2
| Status Information
Traffic Graphs
– 39 –
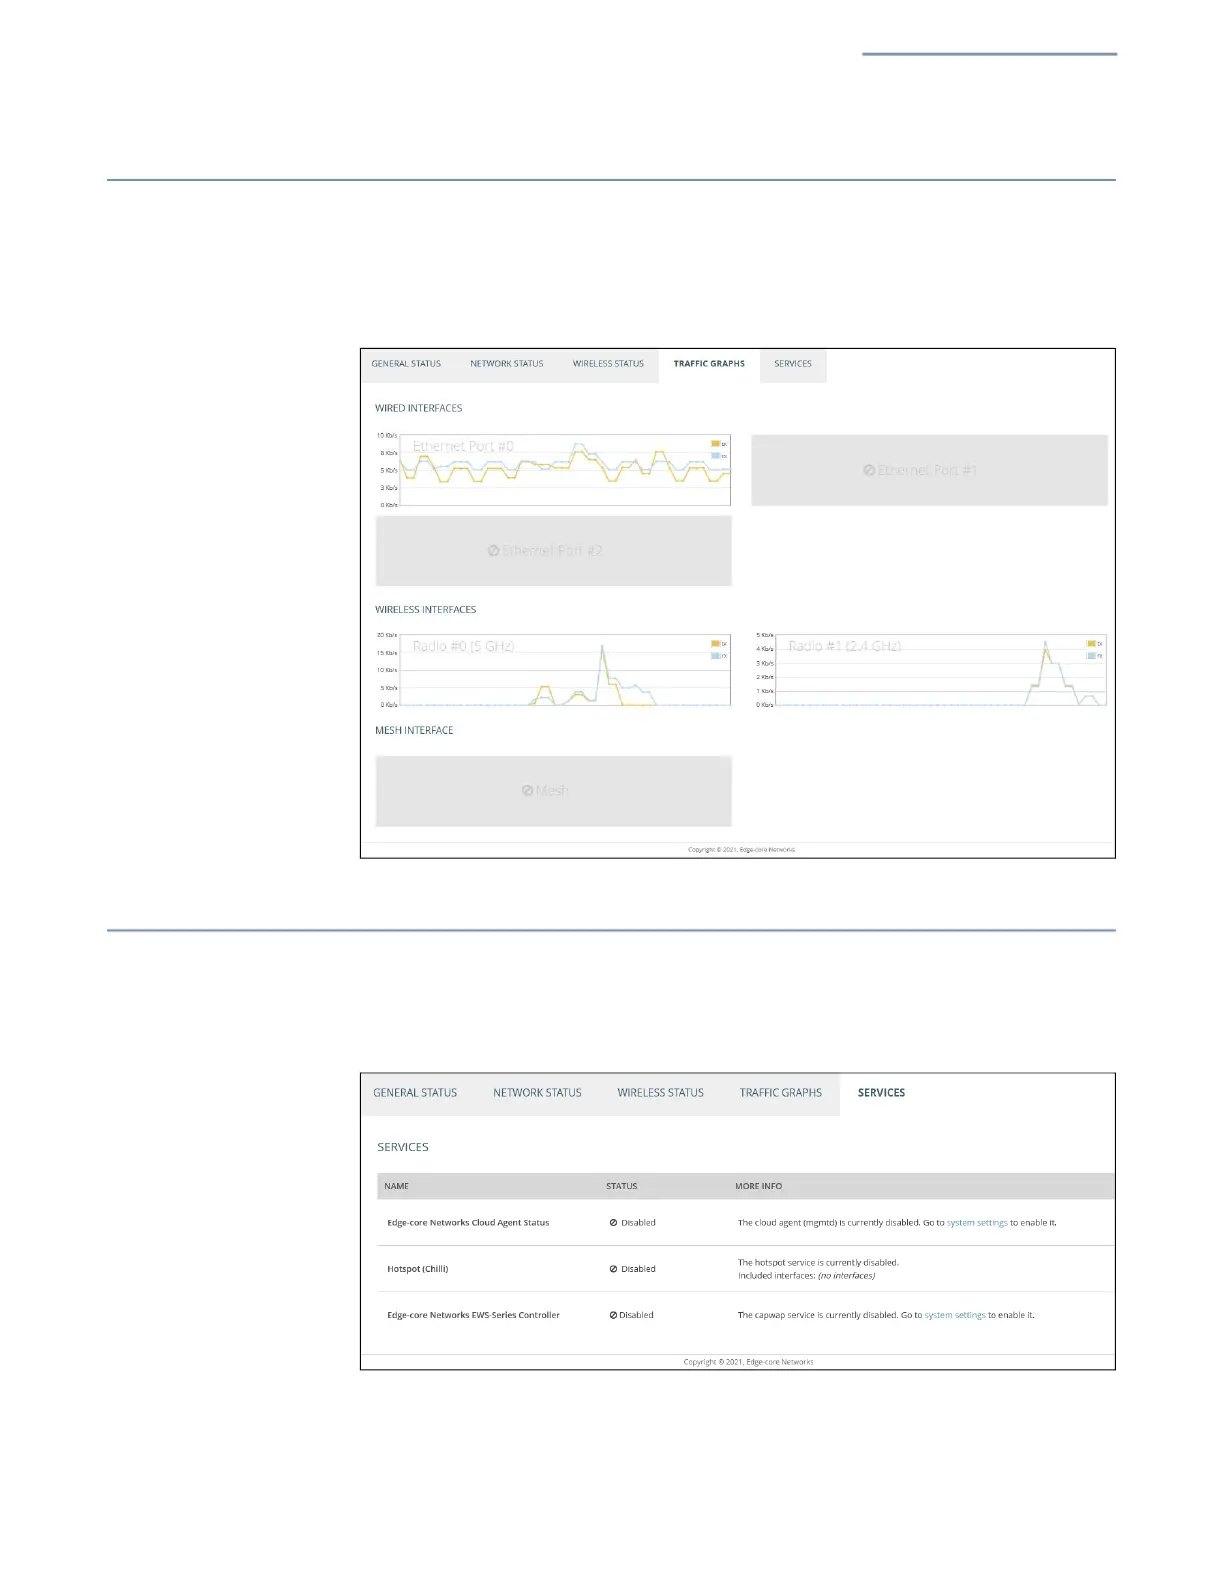
Traffic Graphs
The Traffic Graphs section shows the data rate for the Ethernet ports, wireless
interfaces, and mesh interface.
Figure 21: Traffic Graphs
Services
The Services section shows the status of the Edgecore cloud management agent.
Figure 22: Services
Edge-core Networks Cloud Agent Status — Shows whether or not the agent
for the cloud controller is enabled.