12 DCM00003 REV. 07
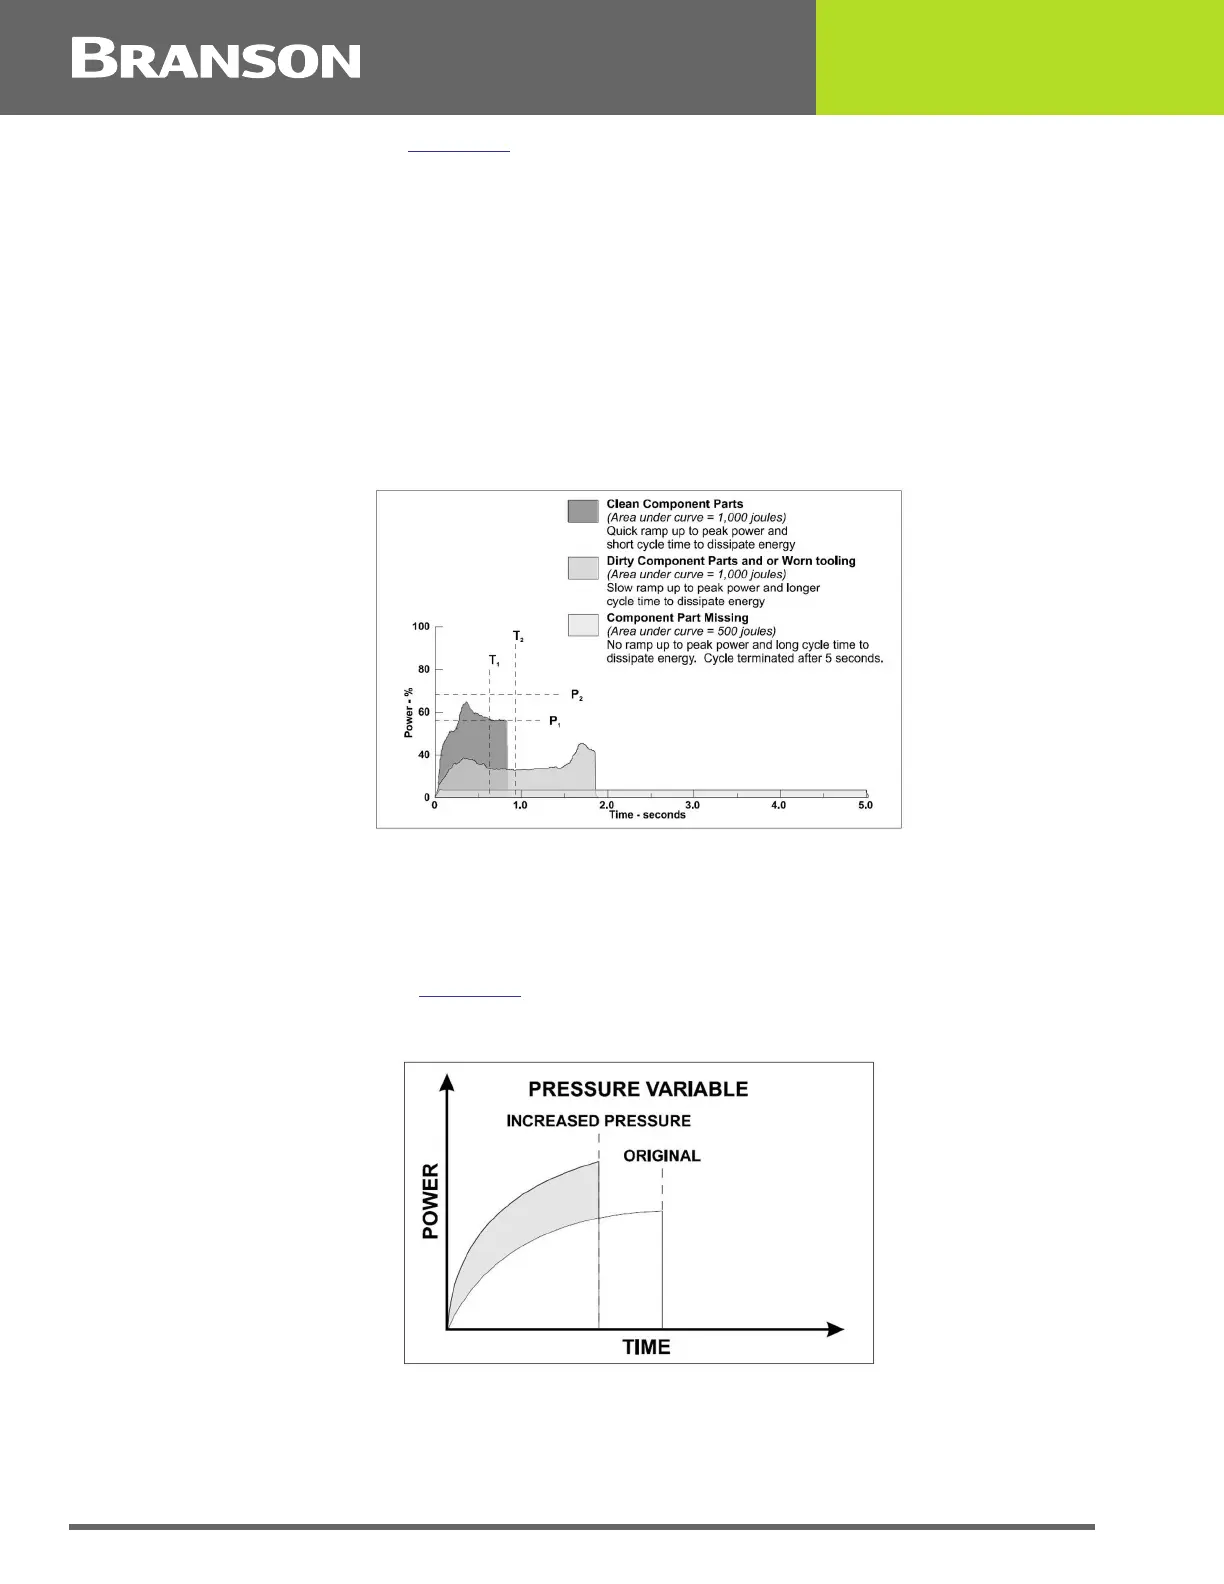
The following graph (Figure 2.3) illustrates a weld produced. The weld ‘power graph’ is
sometimes referred to a weld ‘footprint’. It can be used to visualize the weld cycle and
assists in parameter optimization. Graphs from consecutive welds will vary slightly as the
system dynamically adjusts time to accommodate varying surface conditions. The weld
power data is gathered by sampling the power used in 5 millisecond intervals.
Power
The converter/ booster/ horn, (stack assembly), requires minimal electrical power to
initiate and maintain motion (vibration) at a ‘no-load’ condition. As the mechanical load
increases, the power required to maintain the mechanical vibration also increases. The
maximum power required during a weld cycle is ‘Peak Power’.
Figure 2.3 Weld ‘power graph’ (weld footprint)
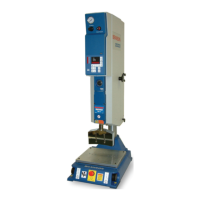
By increasing Pressure and maintaining all other parameters, the mechanical load or force
on the weld joint increases, therefore, the amount of Power required to maintain the
vibration of the stack increases. Subsequently, because of the increased Power Level, less
time is required to deliver the same amount of Energy. This relationship is illustrated in
the following diagram (Figure 2.4
):
Figure 2.4 Pressure, Power, and Time relationship
The difference in the appearance of each of the above weld graphs is the result of
increased Power loading. Based upon an increase in Pressure, additional Power is required
to maintain the motion of vibration. Thus, the same amount of energy is delivered in less
time. This approach is typically used to raise the loading of the power supply during a weld
cycle to the desired level as determined by the application.