58 |
patiEnt anaLysis
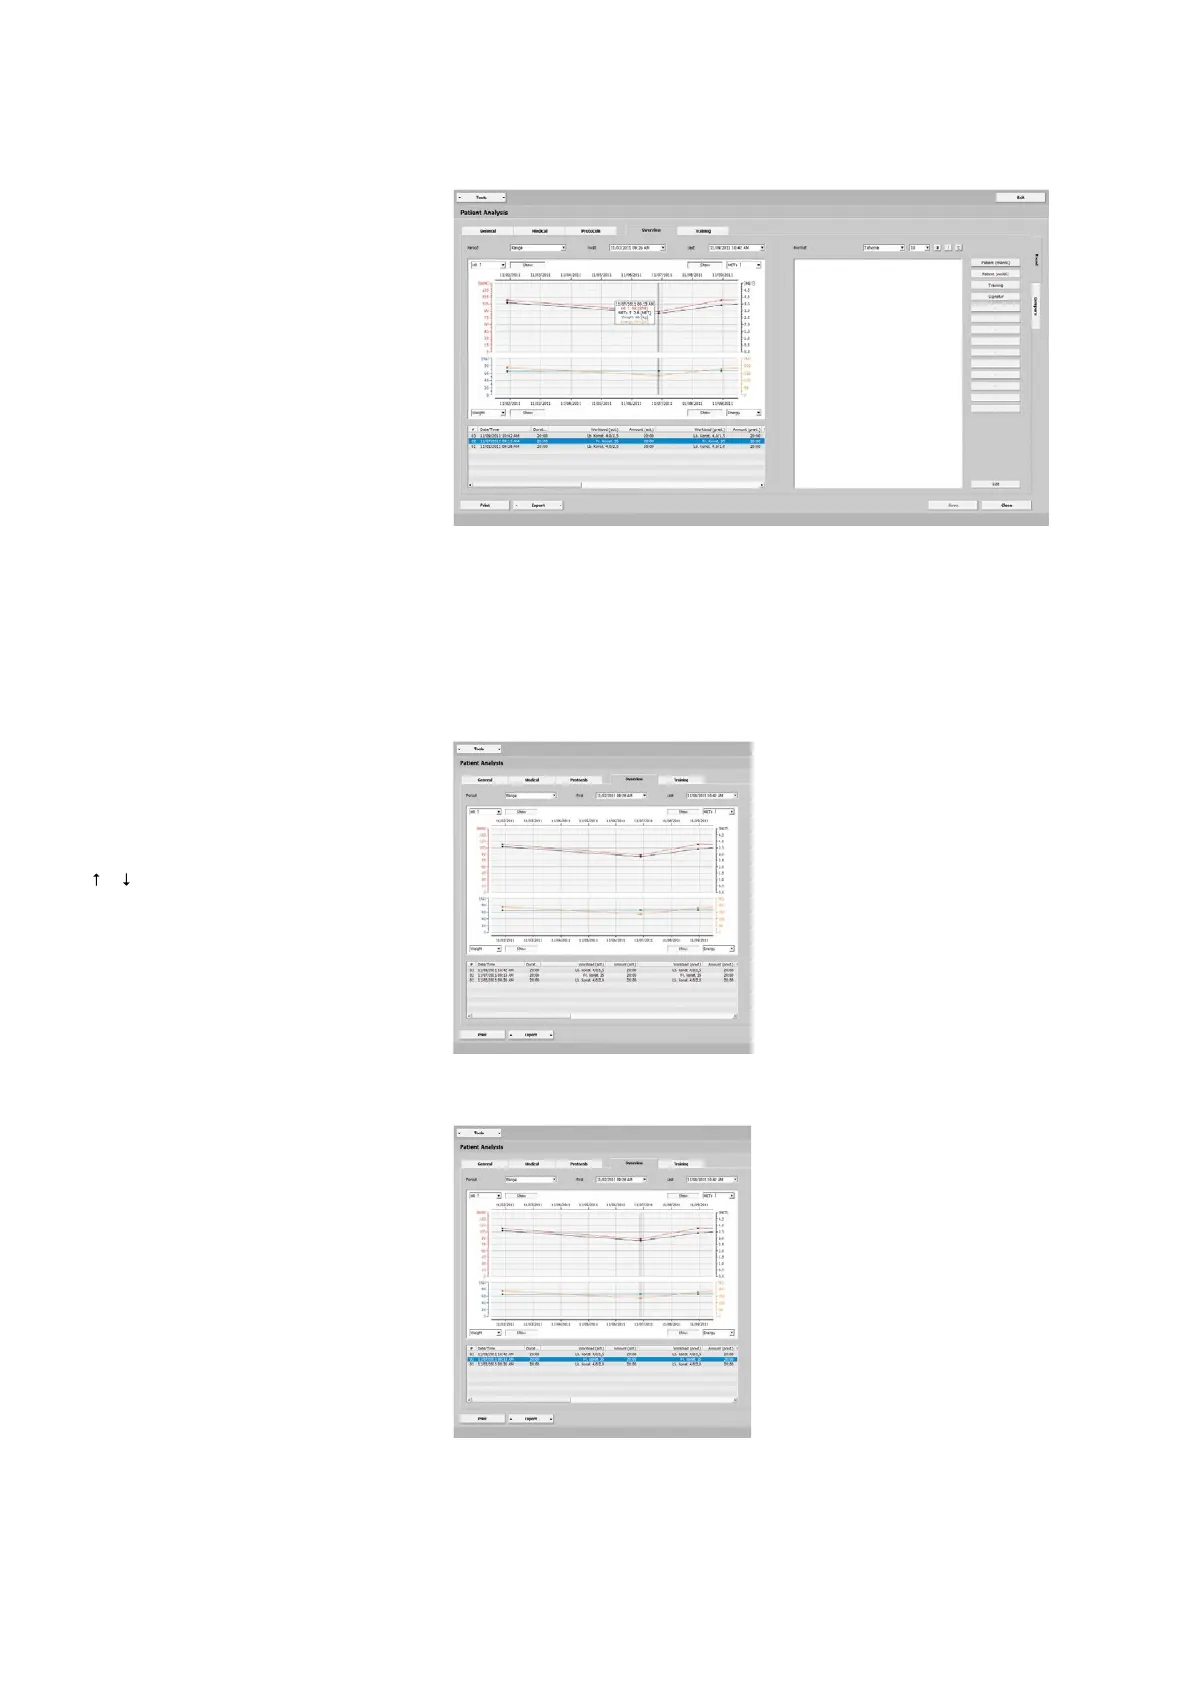
ovErviEw - trEnd
This screen provides an overview of all
analyzed parameters, such as:
- HR
- BP
- SpO2
- METs
- W/kg
- Load
- RPM
- Spd.
- Slp.
- Energy
- Distance
- Weight
When you move the mouse cursor over
the curves, the values will be updated
and displayed.
At Period, you can choose from various
options. You can change the displayed
time window easily be selecting the high-
lighted option (blue) and scrolling or you
can use the arrow keys on the keyboard
[ ] [ ]. All training sessions are listed in
the area below the curves.
Analyzing the Training Sessions
In the corners of the diagram, choose the
values to be displayed (e.g., the minimum,
maximum, first/last average value).
When you click
[ Show ], the correspond-
ing values and training sessions (data
points) will be alternately shown and
hidden. The different colors make the
differentiation easier. The selected train-
ing session is highlighted with a dark bar
cursor.
Additional details of all trainings are pro-
vided in text form below the curves.