60 |
patiEnt anaLysis
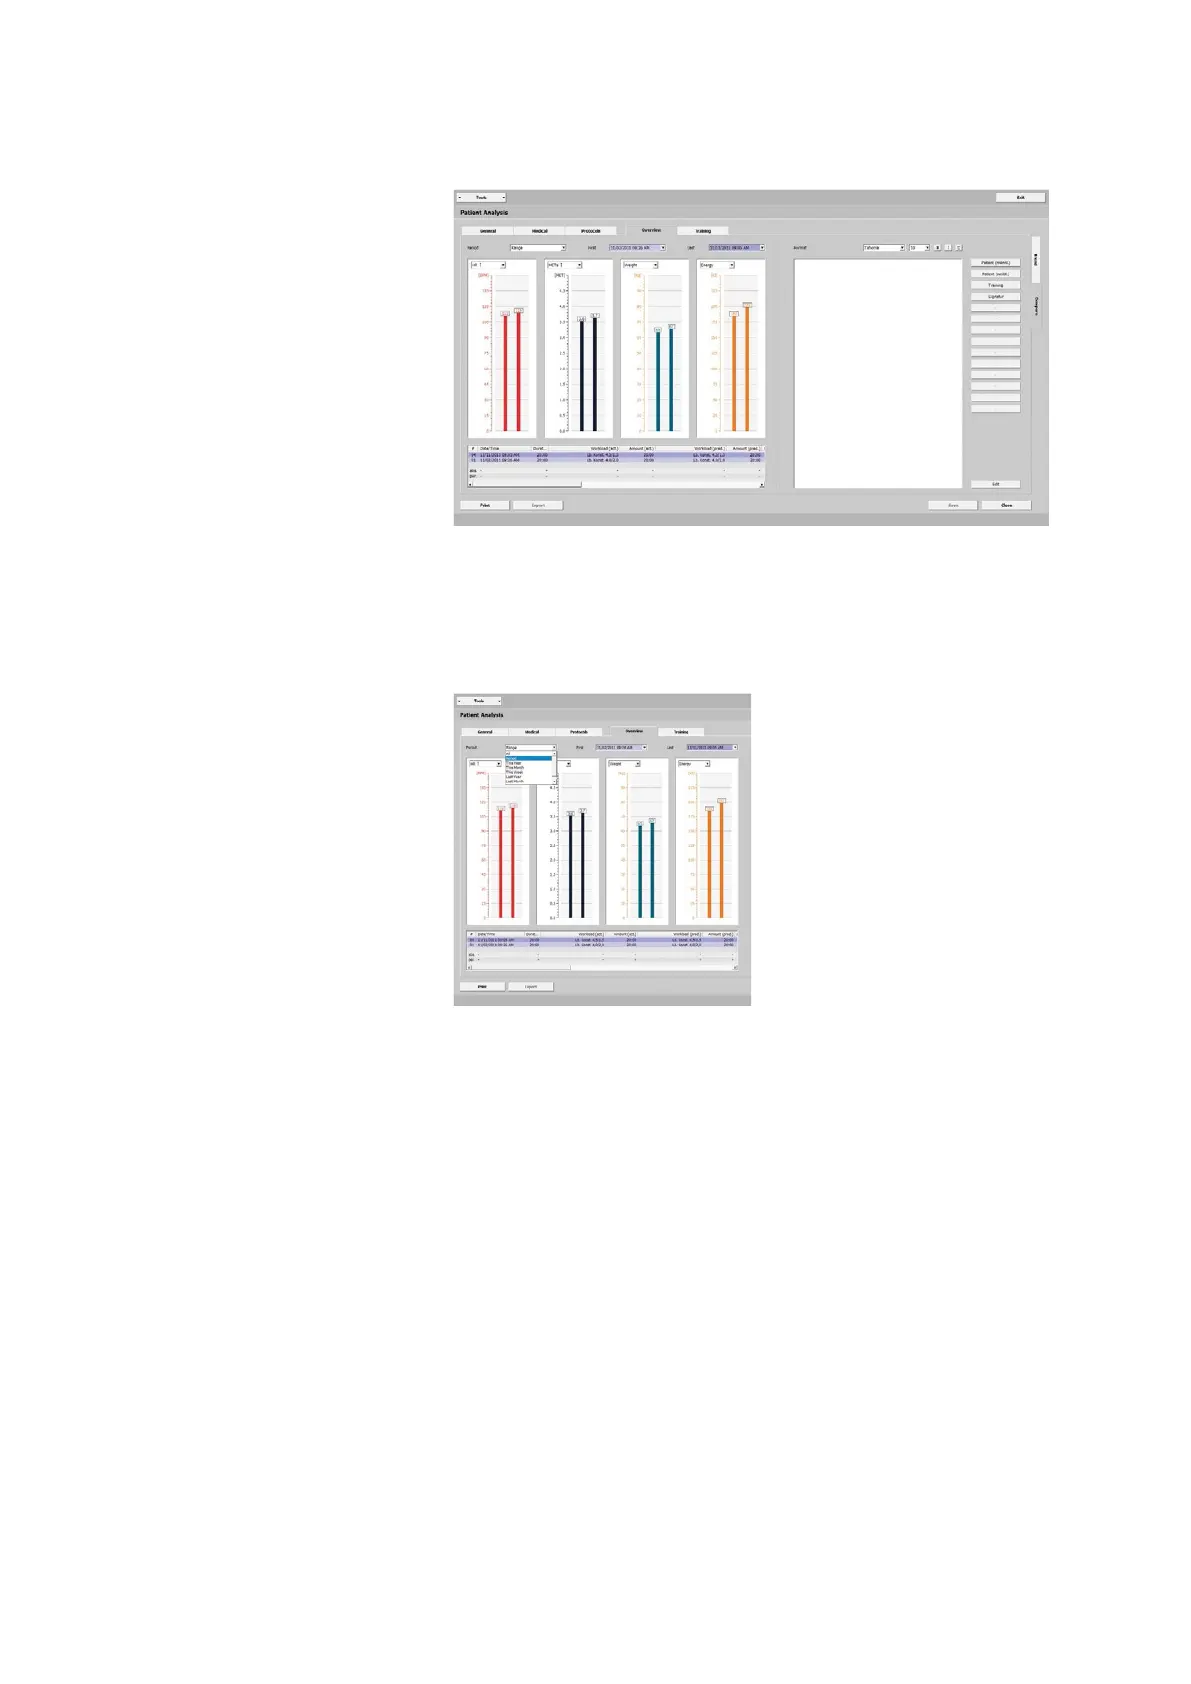
ovErviEw - CoMparE
In this overview, two training sessions
are compared.
The illustration shows measured values
for:
- HR
- BP
- SpO2
- METs
- W/kg
- Load
- RPM
- Spd.
- Slp.
- Energy
- Distance
- Weight
From the drop-down lists, select the pe-
riod of time of the training sessions and
the values you want to compare. The re-
sults will be displayed in the form of bar
charts. All parameter values (such as HR,
BP, or SpO2) from the two sessions can
be compared in this way.
Again, all information about the training
sessions are presented in tabular form
below the bar charts.
With
[ Print ] you obtain a printout of the
overview.